Data
116,293 items of data are available, covering 97,591 participants.
Some values have special meanings defined by Data-Coding
909.
Defined-instances run from 2 to 4, labelled using Instancing
2.
Units of measurement are micrometres.
| Maximum | 2618 |
| Decile 9 | 912 |
| Decile 8 | 821 |
| Decile 7 | 763 |
| Decile 6 | 717 |
| Median | 678 |
| Decile 4 | 644 |
| Decile 3 | 610 |
| Decile 2 | 575 |
| Decile 1 | 532 |
| Minimum | 275 |
|
|
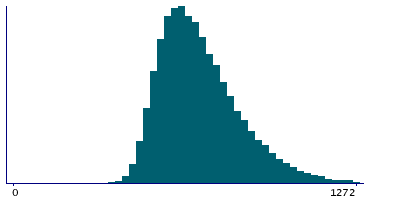
- Mean = 705.324
- Std.dev = 157.537
- 561 items above graph maximum of 1292
- 288 items have value 0 (Measure invalid)
|
2 Instances
Instance 2 : Imaging visit (2014+)
96,663 participants, 96,399 items
| Maximum | 2618 |
| Decile 9 | 908 |
| Decile 8 | 818 |
| Decile 7 | 760 |
| Decile 6 | 715 |
| Median | 676 |
| Decile 4 | 641 |
| Decile 3 | 608 |
| Decile 2 | 573 |
| Decile 1 | 531 |
| Minimum | 275 |
|

|
- Mean = 702.626
- Std.dev = 156.383
- 472 items above graph maximum of 1285
- 264 items have value 0 (Measure invalid)
|
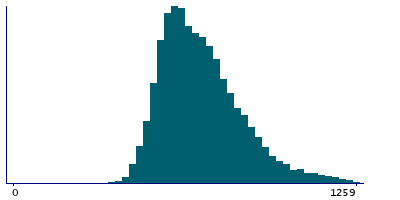
Instance 3 : First repeat imaging visit (2019+)
19,600 participants, 19,576 items
| Maximum | 1844 |
| Decile 9 | 928 |
| Decile 8 | 837 |
| Decile 7 | 778 |
| Decile 6 | 731 |
| Median | 693 |
| Decile 4 | 656 |
| Decile 3 | 620 |
| Decile 2 | 584 |
| Decile 1 | 542 |
| Minimum | 361 |
|
|
- Mean = 718.512
- Std.dev = 162.364
- 101 items above graph maximum of 1314
- 24 items have value 0 (Measure invalid)
|


