Data
115,441 items of data are available, covering 96,956 participants.
Some values have special meanings defined by Data-Coding
909.
Defined-instances run from 2 to 4, labelled using Instancing
2.
Units of measurement are micrometres.
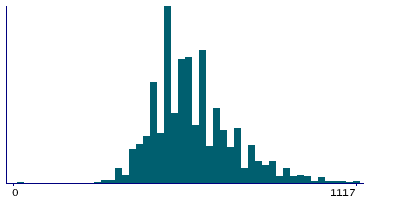
| Maximum | 2430 |
| Decile 9 | 808 |
| Decile 8 | 693 |
| Decile 7 | 654 |
| Decile 6 | 616 |
| Median | 577 |
| Decile 4 | 539 |
| Decile 3 | 500 |
| Decile 2 | 500 |
| Decile 1 | 460 |
| Minimum | 10 |
|
|
- Mean = 601.767
- Std.dev = 147.35
- 427 items above graph maximum of 1156
- 225 items have value 0 (Measure invalid)
|
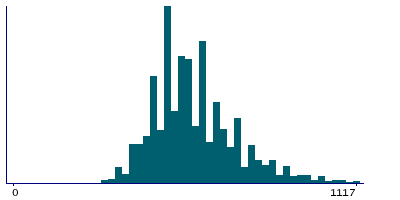
2 Instances
Instance 2 : Imaging visit (2014+)
95,936 participants, 95,736 items
| Maximum | 2430 |
| Decile 9 | 808 |
| Decile 8 | 693 |
| Decile 7 | 654 |
| Decile 6 | 616 |
| Median | 577 |
| Decile 4 | 539 |
| Decile 3 | 500 |
| Decile 2 | 500 |
| Decile 1 | 450 |
| Minimum | 10 |
|
|
- Mean = 600.101
- Std.dev = 146.787
- 341 items above graph maximum of 1166
- 200 items have value 0 (Measure invalid)
|
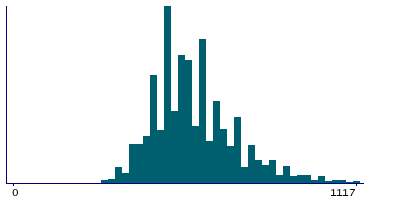
Instance 3 : First repeat imaging visit (2019+)
19,475 participants, 19,450 items
| Maximum | 1694 |
| Decile 9 | 808 |
| Decile 8 | 731 |
| Decile 7 | 654 |
| Decile 6 | 616 |
| Median | 577 |
| Decile 4 | 539 |
| Decile 3 | 539 |
| Decile 2 | 500 |
| Decile 1 | 462 |
| Minimum | 20 |
|
|
- Mean = 609.859
- Std.dev = 149.694
- 107 items above graph maximum of 1154
- 25 items have value 0 (Measure invalid)
|


