Data
115,441 items of data are available, covering 96,956 participants.
Some values have special meanings defined by Data-Coding
909.
Defined-instances run from 2 to 4, labelled using Instancing
2.
Units of measurement are micrometres.
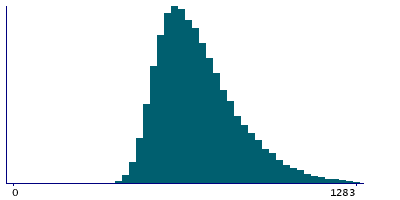
| Maximum | 4233 |
| Decile 9 | 921 |
| Decile 8 | 826 |
| Decile 7 | 765 |
| Decile 6 | 718 |
| Median | 680 |
| Decile 4 | 643 |
| Decile 3 | 609 |
| Decile 2 | 575 |
| Decile 1 | 534 |
| Minimum | 25 |
|

|
- Mean = 708.472
- Std.dev = 162.515
- 639 items above graph maximum of 1308
- 222 items have value 0 (Measure invalid)
|
2 Instances
Instance 2 : Imaging visit (2014+)
95,936 participants, 95,738 items
| Maximum | 4233 |
| Decile 9 | 917 |
| Decile 8 | 822 |
| Decile 7 | 761 |
| Decile 6 | 715 |
| Median | 677 |
| Decile 4 | 641 |
| Decile 3 | 607 |
| Decile 2 | 573 |
| Decile 1 | 532 |
| Minimum | 25 |
|
|
- Mean = 705.736
- Std.dev = 161.65
- 516 items above graph maximum of 1302
- 198 items have value 0 (Measure invalid)
|
Instance 3 : First repeat imaging visit (2019+)
19,475 participants, 19,451 items
| Maximum | 1822 |
| Decile 9 | 939 |
| Decile 8 | 841 |
| Decile 7 | 781 |
| Decile 6 | 733 |
| Median | 691 |
| Decile 4 | 654 |
| Decile 3 | 620 |
| Decile 2 | 585 |
| Decile 1 | 543 |
| Minimum | 366 |
|

|
- Mean = 721.809
- Std.dev = 165.968
- 114 items above graph maximum of 1335
- 24 items have value 0 (Measure invalid)
|


