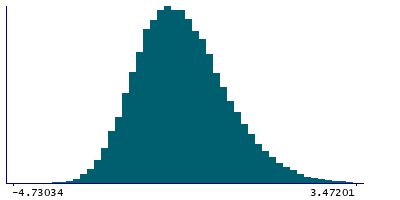
Data
50,085 items of data are available, covering 46,633 participants.
Defined-instances run from 2 to 3, labelled using Instancing
2.
Units of measurement are Std.Devs.
| Maximum | 7.93665 |
| Decile 9 | 0.737971 |
| Decile 8 | 0.176964 |
| Decile 7 | -0.197682 |
| Decile 6 | -0.504897 |
| Median | -0.779256 |
| Decile 4 | -1.04874 |
| Decile 3 | -1.31726 |
| Decile 2 | -1.60988 |
| Decile 1 | -1.9959 |
| Minimum | -7.25979 |
|
|
- Mean = -0.690294
- Std.dev = 1.08769
- 6 items below graph minimum of -4.72978
- 76 items above graph maximum of 3.47184
|
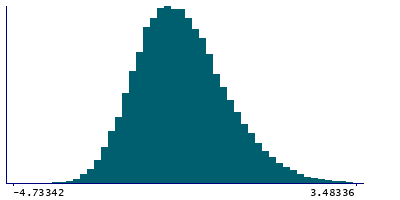
2 Instances
Instance 2 : Imaging visit (2014+)
46,180 participants, 46,180 items
| Maximum | 7.93665 |
| Decile 9 | 0.74444 |
| Decile 8 | 0.180081 |
| Decile 7 | -0.196283 |
| Decile 6 | -0.503219 |
| Median | -0.777273 |
| Decile 4 | -1.0489 |
| Decile 3 | -1.31796 |
| Decile 2 | -1.60839 |
| Decile 1 | -1.99441 |
| Minimum | -7.25979 |
|
|
- Mean = -0.688868
- Std.dev = 1.08913
- 6 items below graph minimum of -4.73327
- 70 items above graph maximum of 3.48329
|
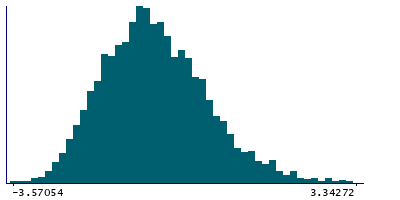
Instance 3 : First repeat imaging visit (2019+)
3,905 participants, 3,905 items
| Maximum | 6.82527 |
| Decile 9 | 0.662717 |
| Decile 8 | 0.143662 |
| Decile 7 | -0.208568 |
| Decile 6 | -0.52537 |
| Median | -0.795848 |
| Decile 4 | -1.04482 |
| Decile 3 | -1.30981 |
| Decile 2 | -1.63273 |
| Decile 1 | -2.0156 |
| Minimum | -3.57054 |
|
|
- Mean = -0.707162
- Std.dev = 1.0704
- 5 items above graph maximum of 3.34104
|