Data
51,751 items of data are available, covering 48,175 participants.
Defined-instances run from 2 to 3, labelled using Instancing
2.
Units of measurement are Std.Devs.
| Maximum | 8.02368 |
| Decile 9 | 0.685581 |
| Decile 8 | 0.139868 |
| Decile 7 | -0.241015 |
| Decile 6 | -0.548185 |
| Median | -0.819114 |
| Decile 4 | -1.08278 |
| Decile 3 | -1.34732 |
| Decile 2 | -1.63958 |
| Decile 1 | -2.02801 |
| Minimum | -7.26733 |
|
|
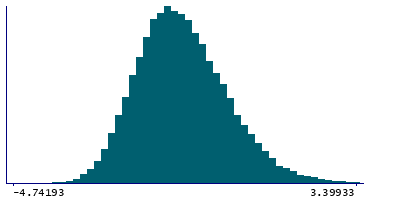
- Mean = -0.728416
- Std.dev = 1.0782
- 1 item below graph minimum of -4.74161
- 70 items above graph maximum of 3.39918
|
2 Instances
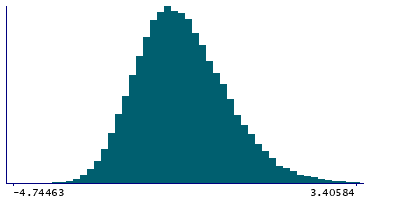
Instance 2 : Imaging visit (2014+)
47,744 participants, 47,744 items
| Maximum | 8.02368 |
| Decile 9 | 0.689026 |
| Decile 8 | 0.142569 |
| Decile 7 | -0.239746 |
| Decile 6 | -0.547361 |
| Median | -0.817354 |
| Decile 4 | -1.08185 |
| Decile 3 | -1.3456 |
| Decile 2 | -1.63956 |
| Decile 1 | -2.02781 |
| Minimum | -7.26733 |
|
|
- Mean = -0.726451
- Std.dev = 1.08002
- 1 item below graph minimum of -4.74465
- 64 items above graph maximum of 3.40586
|
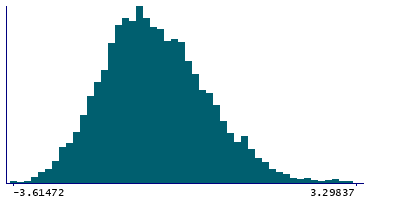
Instance 3 : First repeat imaging visit (2019+)
4,007 participants, 4,007 items
| Maximum | 3.83472 |
| Decile 9 | 0.63104 |
| Decile 8 | 0.107447 |
| Decile 7 | -0.247924 |
| Decile 6 | -0.560121 |
| Median | -0.834761 |
| Decile 4 | -1.09566 |
| Decile 3 | -1.36373 |
| Decile 2 | -1.64016 |
| Decile 1 | -2.03582 |
| Minimum | -3.61472 |
|
|
- Mean = -0.751824
- Std.dev = 1.05596
- 5 items above graph maximum of 3.2979
|