Data
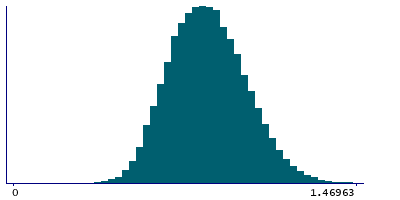
74,616 items of data are available, covering 69,208 participants.
Defined-instances run from 2 to 3, labelled using Instancing
2.
Units of measurement are g/cm2.
| Maximum | 2.15522 |
| Decile 9 | 1.04398 |
| Decile 8 | 0.965359 |
| Decile 7 | 0.908842 |
| Decile 6 | 0.860415 |
| Median | 0.816255 |
| Decile 4 | 0.772749 |
| Decile 3 | 0.727682 |
| Decile 2 | 0.678624 |
| Decile 1 | 0.613904 |
| Minimum | 0 |
|
|
- Mean = 0.823769
- Std.dev = 0.167018
- 20 items above graph maximum of 1.47405
|
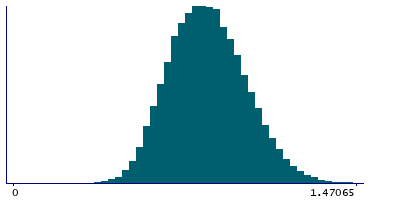
2 Instances
Instance 2 : Imaging visit (2014+)
68,859 participants, 68,859 items
| Maximum | 2.15522 |
| Decile 9 | 1.04452 |
| Decile 8 | 0.965752 |
| Decile 7 | 0.90907 |
| Decile 6 | 0.860764 |
| Median | 0.816415 |
| Decile 4 | 0.773027 |
| Decile 3 | 0.728121 |
| Decile 2 | 0.678862 |
| Decile 1 | 0.614332 |
| Minimum | 0 |
|
|
- Mean = 0.824115
- Std.dev = 0.167119
- 19 items above graph maximum of 1.47471
|
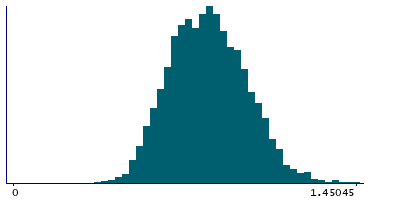
Instance 3 : First repeat imaging visit (2019+)
5,757 participants, 5,757 items
| Maximum | 1.49624 |
| Decile 9 | 1.03649 |
| Decile 8 | 0.961401 |
| Decile 7 | 0.905726 |
| Decile 6 | 0.857016 |
| Median | 0.814165 |
| Decile 4 | 0.768307 |
| Decile 3 | 0.723058 |
| Decile 2 | 0.676527 |
| Decile 1 | 0.608756 |
| Minimum | 0.272124 |
|
|
- Mean = 0.819636
- Std.dev = 0.165757
- 1 item above graph maximum of 1.46422
|