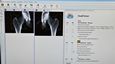
Data
39,618 items of data are available, covering 37,214 participants.
Defined-instances run from 2 to 3, labelled using Instancing
2.
Units of measurement are cm2.
| Maximum | 576.808 |
| Decile 9 | 462.21 |
| Decile 8 | 440.805 |
| Decile 7 | 423.455 |
| Decile 6 | 406.93 |
| Median | 391.27 |
| Decile 4 | 376.8 |
| Decile 3 | 363.384 |
| Decile 2 | 349.683 |
| Decile 1 | 332.477 |
| Minimum | 76.7147 |
|

|
- Mean = 394.747
- Std.dev = 49.8953
- 3 items below graph minimum of 202.744
|
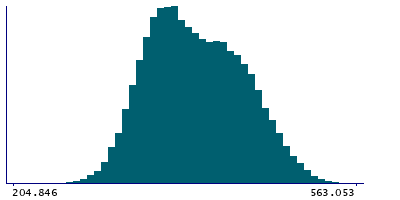
2 Instances
Instance 2 : Imaging visit (2014+)
35,837 participants, 35,837 items
| Maximum | 576.808 |
| Decile 9 | 462.191 |
| Decile 8 | 440.723 |
| Decile 7 | 423.368 |
| Decile 6 | 406.741 |
| Median | 391.154 |
| Decile 4 | 376.596 |
| Decile 3 | 363.315 |
| Decile 2 | 349.686 |
| Decile 1 | 332.529 |
| Minimum | 76.7147 |
|
|
- Mean = 394.667
- Std.dev = 49.8331
- 3 items below graph minimum of 202.868
|
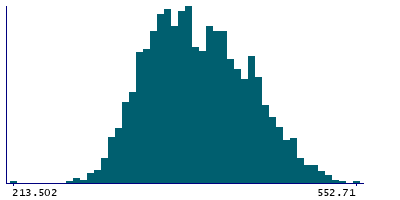
Instance 3 : First repeat imaging visit (2019+)
3,781 participants, 3,781 items
| Maximum | 552.71 |
| Decile 9 | 462.267 |
| Decile 8 | 442.378 |
| Decile 7 | 424.434 |
| Decile 6 | 408.766 |
| Median | 392.732 |
| Decile 4 | 378.302 |
| Decile 3 | 364.18 |
| Decile 2 | 349.539 |
| Decile 1 | 332.014 |
| Minimum | 213.502 |
|
|
- Mean = 395.5
- Std.dev = 50.4746
|