Data
78,765 items of data are available, covering 72,674 participants.
Defined-instances run from 2 to 3, labelled using Instancing
2.
Units of measurement are cm2.
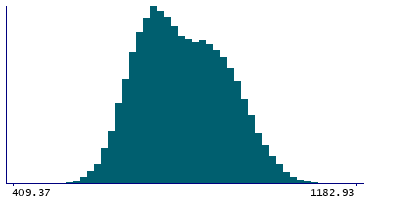
| Maximum | 3727.91 |
| Decile 9 | 923.384 |
| Decile 8 | 881.073 |
| Decile 7 | 846.801 |
| Decile 6 | 814.206 |
| Median | 782.241 |
| Decile 4 | 753.315 |
| Decile 3 | 726.548 |
| Decile 2 | 699.424 |
| Decile 1 | 665.445 |
| Minimum | 0 |
|
|
- Mean = 789.41
- Std.dev = 100.358
- 9 items below graph minimum of 407.506
- 3 items above graph maximum of 1181.32
|
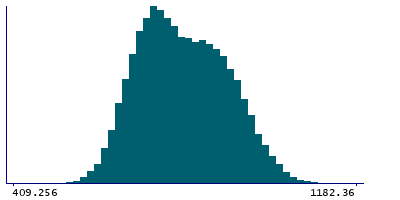
2 Instances
Instance 2 : Imaging visit (2014+)
72,404 participants, 72,404 items
| Maximum | 3727.91 |
| Decile 9 | 923.211 |
| Decile 8 | 880.754 |
| Decile 7 | 846.467 |
| Decile 6 | 813.786 |
| Median | 781.93 |
| Decile 4 | 753.109 |
| Decile 3 | 726.298 |
| Decile 2 | 699.31 |
| Decile 1 | 665.326 |
| Minimum | 0 |
|
|
- Mean = 789.169
- Std.dev = 100.426
- 8 items below graph minimum of 407.442
- 3 items above graph maximum of 1181.1
|
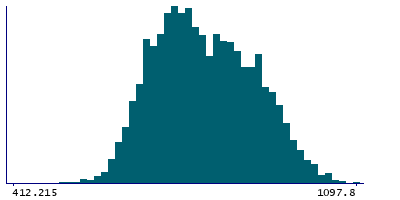
Instance 3 : First repeat imaging visit (2019+)
6,361 participants, 6,361 items
| Maximum | 1102.29 |
| Decile 9 | 926.144 |
| Decile 8 | 886.013 |
| Decile 7 | 850.165 |
| Decile 6 | 819.08 |
| Median | 785.75 |
| Decile 4 | 756.36 |
| Decile 3 | 729.28 |
| Decile 2 | 701.43 |
| Decile 1 | 667.093 |
| Minimum | 0 |
|
|
- Mean = 792.161
- Std.dev = 99.5348
- 1 item below graph minimum of 408.043
|