Data
75,079 items of data are available, covering 70,785 participants.
Defined-instances run from 2 to 3, labelled using Instancing
2.
| Maximum | 37.8945 |
| Decile 9 | 2.17344 |
| Decile 8 | 1.68152 |
| Decile 7 | 1.39722 |
| Decile 6 | 1.18612 |
| Median | 1.01494 |
| Decile 4 | 0.868082 |
| Decile 3 | 0.735381 |
| Decile 2 | 0.609102 |
| Decile 1 | 0.471311 |
| Minimum | 0.117864 |
|
|
- Mean = 1.22328
- Std.dev = 0.87396
- 1057 items above graph maximum of 3.87557
|
2 Instances
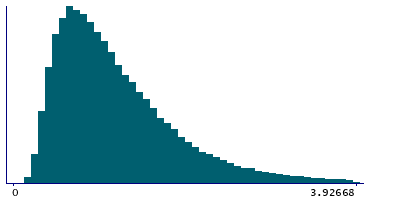
Instance 2 : Imaging visit (2014+)
70,421 participants, 70,421 items
| Maximum | 37.8945 |
| Decile 9 | 2.17355 |
| Decile 8 | 1.68032 |
| Decile 7 | 1.39502 |
| Decile 6 | 1.18307 |
| Median | 1.01146 |
| Decile 4 | 0.864513 |
| Decile 3 | 0.731641 |
| Decile 2 | 0.60576 |
| Decile 1 | 0.468777 |
| Minimum | 0.117864 |
|

|
- Mean = 1.22097
- Std.dev = 0.875169
- 995 items above graph maximum of 3.87832
|
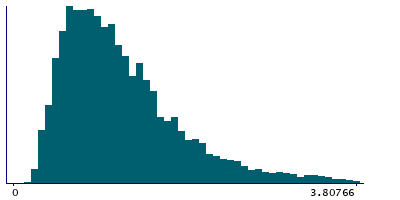
Instance 3 : First repeat imaging visit (2019+)
4,658 participants, 4,658 items
| Maximum | 16.1478 |
| Decile 9 | 2.1634 |
| Decile 8 | 1.70032 |
| Decile 7 | 1.4307 |
| Decile 6 | 1.22877 |
| Median | 1.0713 |
| Decile 4 | 0.922856 |
| Decile 3 | 0.793073 |
| Decile 2 | 0.656035 |
| Decile 1 | 0.518711 |
| Minimum | 0.19526 |
|
|
- Mean = 1.2581
- Std.dev = 0.854718
- 65 items above graph maximum of 3.80809
|