Data
75,079 items of data are available, covering 70,785 participants.
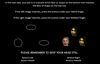
Defined-instances run from 2 to 3, labelled using Instancing
2.
| Maximum | 38.2148 |
| Decile 9 | 2.80461 |
| Decile 8 | 2.19941 |
| Decile 7 | 1.84918 |
| Decile 6 | 1.59008 |
| Median | 1.36842 |
| Decile 4 | 1.16996 |
| Decile 3 | 0.985471 |
| Decile 2 | 0.814769 |
| Decile 1 | 0.630236 |
| Minimum | 0.17498 |
|
|
- Mean = 1.60934
- Std.dev = 1.09709
- 1024 items above graph maximum of 4.97898
|
2 Instances
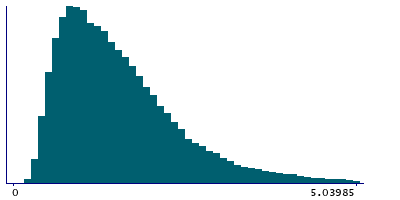
Instance 2 : Imaging visit (2014+)
70,421 participants, 70,421 items
| Maximum | 38.2148 |
| Decile 9 | 2.80425 |
| Decile 8 | 2.19967 |
| Decile 7 | 1.84804 |
| Decile 6 | 1.58795 |
| Median | 1.365 |
| Decile 4 | 1.16559 |
| Decile 3 | 0.98131 |
| Decile 2 | 0.811551 |
| Decile 1 | 0.62708 |
| Minimum | 0.17498 |
|
|
- Mean = 1.60734
- Std.dev = 1.10018
- 965 items above graph maximum of 4.98141
|
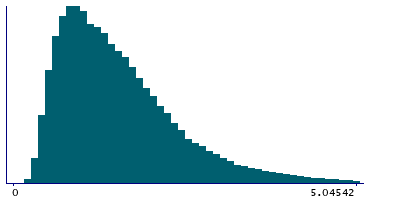
Instance 3 : First repeat imaging visit (2019+)
4,658 participants, 4,658 items
| Maximum | 17.3872 |
| Decile 9 | 2.81751 |
| Decile 8 | 2.19455 |
| Decile 7 | 1.86816 |
| Decile 6 | 1.62101 |
| Median | 1.41195 |
| Decile 4 | 1.22996 |
| Decile 3 | 1.05098 |
| Decile 2 | 0.865308 |
| Decile 1 | 0.687383 |
| Minimum | 0.275808 |
|
|
- Mean = 1.63969
- Std.dev = 1.04881
- 58 items above graph maximum of 4.94763
|