Data
75,079 items of data are available, covering 70,785 participants.
Defined-instances run from 2 to 3, labelled using Instancing
2.
| Maximum | 6.79189 |
| Decile 9 | 0.406847 |
| Decile 8 | 0.333587 |
| Decile 7 | 0.292125 |
| Decile 6 | 0.261436 |
| Median | 0.236129 |
| Decile 4 | 0.213097 |
| Decile 3 | 0.192159 |
| Decile 2 | 0.170106 |
| Decile 1 | 0.144428 |
| Minimum | 0.0462848 |
|

|
- Mean = 0.262382
- Std.dev = 0.127915
- 850 items above graph maximum of 0.669267
|
2 Instances
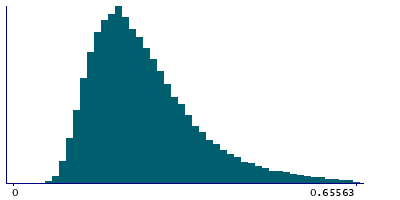
Instance 2 : Imaging visit (2014+)
70,421 participants, 70,421 items
| Maximum | 6.79189 |
| Decile 9 | 0.408515 |
| Decile 8 | 0.334889 |
| Decile 7 | 0.293207 |
| Decile 6 | 0.262303 |
| Median | 0.236967 |
| Decile 4 | 0.213781 |
| Decile 3 | 0.192734 |
| Decile 2 | 0.170507 |
| Decile 1 | 0.144737 |
| Minimum | 0.050607 |
|
|
- Mean = 0.263369
- Std.dev = 0.128775
- 806 items above graph maximum of 0.672293
|
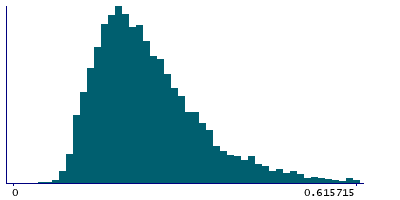
Instance 3 : First repeat imaging visit (2019+)
4,658 participants, 4,658 items
| Maximum | 2.94465 |
| Decile 9 | 0.377922 |
| Decile 8 | 0.314719 |
| Decile 7 | 0.276788 |
| Decile 6 | 0.249098 |
| Median | 0.225381 |
| Decile 4 | 0.203528 |
| Decile 3 | 0.1842 |
| Decile 2 | 0.164145 |
| Decile 1 | 0.139468 |
| Minimum | 0.0462848 |
|
|
- Mean = 0.247458
- Std.dev = 0.113095
- 45 items above graph maximum of 0.616375
|