Data
90,186 items of data are available, covering 85,097 participants.
Defined-instances run from 2 to 3, labelled using Instancing
2.
| Maximum | 1.10165 |
| Decile 9 | 0.119223 |
| Decile 8 | 0.0985725 |
| Decile 7 | 0.0859296 |
| Decile 6 | 0.0764971 |
| Median | 0.0686769 |
| Decile 4 | 0.0618006 |
| Decile 3 | 0.0550408 |
| Decile 2 | 0.0481063 |
| Decile 1 | 0.040218 |
| Minimum | 0.0128582 |
|
|
- Mean = 0.0758496
- Std.dev = 0.0354693
- 831 items above graph maximum of 0.198229
|
2 Instances
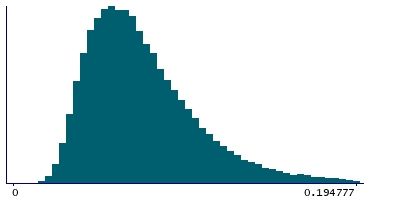
Instance 2 : Imaging visit (2014+)
85,001 participants, 85,001 items
| Maximum | 1.10165 |
| Decile 9 | 0.119896 |
| Decile 8 | 0.0989774 |
| Decile 7 | 0.0862896 |
| Decile 6 | 0.0767535 |
| Median | 0.0689164 |
| Decile 4 | 0.0620458 |
| Decile 3 | 0.0552328 |
| Decile 2 | 0.0482571 |
| Decile 1 | 0.0402957 |
| Minimum | 0.0128582 |
|

|
- Mean = 0.0761434
- Std.dev = 0.0356812
- 778 items above graph maximum of 0.199496
|
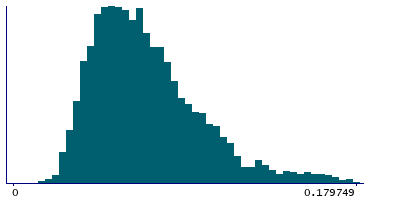
Instance 3 : First repeat imaging visit (2019+)
5,185 participants, 5,185 items
| Maximum | 0.438985 |
| Decile 9 | 0.109218 |
| Decile 8 | 0.0921877 |
| Decile 7 | 0.0805247 |
| Decile 6 | 0.0720518 |
| Median | 0.0652075 |
| Decile 4 | 0.0585168 |
| Decile 3 | 0.0520442 |
| Decile 2 | 0.0458318 |
| Decile 1 | 0.0386873 |
| Minimum | 0.014614 |
|
|
- Mean = 0.0710327
- Std.dev = 0.0314066
- 46 items above graph maximum of 0.179749
|
Notes
90th percentile (across time) of the mean (across space) in-plane displacement from rfMRI
0 Related Data-Fields
There are no related data-fields


