Data
90,186 items of data are available, covering 85,097 participants.
Defined-instances run from 2 to 3, labelled using Instancing
2.
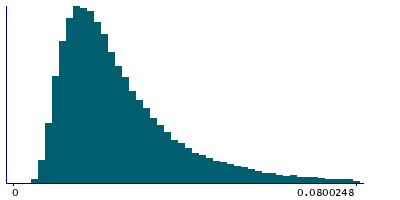
| Maximum | 0.430686 |
| Decile 9 | 0.0464996 |
| Decile 8 | 0.0351944 |
| Decile 7 | 0.0292372 |
| Decile 6 | 0.0250474 |
| Median | 0.02174 |
| Decile 4 | 0.0190311 |
| Decile 3 | 0.016589 |
| Decile 2 | 0.0141536 |
| Decile 1 | 0.0114894 |
| Minimum | 0.00342507 |
|
|
- Mean = 0.0263716
- Std.dev = 0.0171921
- 1361 items above graph maximum of 0.0815097
|
2 Instances
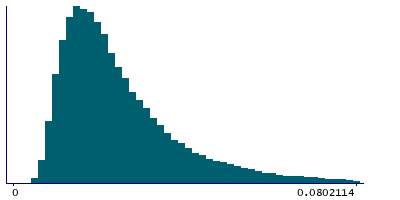
Instance 2 : Imaging visit (2014+)
85,001 participants, 85,001 items
| Maximum | 0.430686 |
| Decile 9 | 0.0465764 |
| Decile 8 | 0.0352746 |
| Decile 7 | 0.0293066 |
| Decile 6 | 0.0250838 |
| Median | 0.0217567 |
| Decile 4 | 0.0190573 |
| Decile 3 | 0.0165926 |
| Decile 2 | 0.0141466 |
| Decile 1 | 0.0114768 |
| Minimum | 0.00367281 |
|
|
- Mean = 0.0264139
- Std.dev = 0.0172707
- 1299 items above graph maximum of 0.081676
|
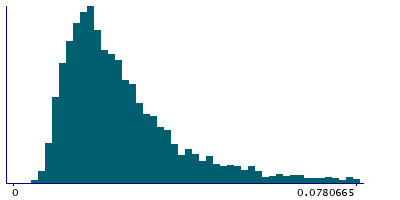
Instance 3 : First repeat imaging visit (2019+)
5,185 participants, 5,185 items
| Maximum | 0.197445 |
| Decile 9 | 0.0448948 |
| Decile 8 | 0.0337226 |
| Decile 7 | 0.0281871 |
| Decile 6 | 0.024417 |
| Median | 0.0214028 |
| Decile 4 | 0.0187339 |
| Decile 3 | 0.0165572 |
| Decile 2 | 0.0142949 |
| Decile 1 | 0.0117231 |
| Minimum | 0.00342507 |
|
|
- Mean = 0.0256776
- Std.dev = 0.0158325
- 74 items above graph maximum of 0.0780665
|
Notes
Mean (across time) of the mean (across space) of Z displacement from rfMRI
0 Related Data-Fields
There are no related data-fields


