Data
70,320 items of data are available, covering 66,459 participants.
Defined-instances run from 2 to 3, labelled using Instancing
2.
Units of measurement are percent.
| Maximum | 3.082 |
| Decile 9 | 0.85 |
| Decile 8 | 0.715 |
| Decile 7 | 0.627 |
| Decile 6 | 0.554 |
| Median | 0.489 |
| Decile 4 | 0.422 |
| Decile 3 | 0.352 |
| Decile 2 | 0.265 |
| Decile 1 | 0.137 |
| Minimum | -8.674 |
|
|
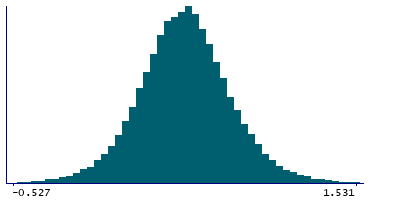
- Mean = 0.487503
- Std.dev = 0.318017
- 257 items below graph minimum of -0.576
- 125 items above graph maximum of 1.563
|
2 Instances
Instance 2 : Imaging visit (2014+)
66,036 participants, 66,036 items
| Maximum | 3.082 |
| Decile 9 | 0.852 |
| Decile 8 | 0.717 |
| Decile 7 | 0.628 |
| Decile 6 | 0.555 |
| Median | 0.489 |
| Decile 4 | 0.422 |
| Decile 3 | 0.35 |
| Decile 2 | 0.264 |
| Decile 1 | 0.135 |
| Minimum | -8.674 |
|
|
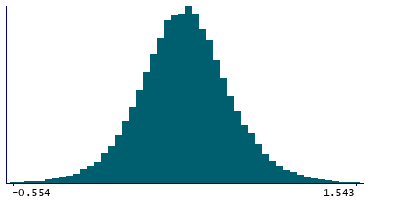
- Mean = 0.487593
- Std.dev = 0.320725
- 240 items below graph minimum of -0.582
- 118 items above graph maximum of 1.569
|
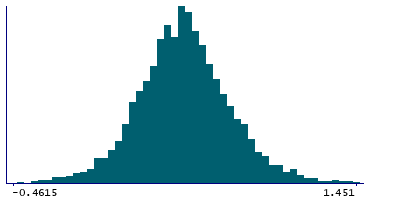
Instance 3 : First repeat imaging visit (2019+)
4,284 participants, 4,284 items
| Maximum | 1.957 |
| Decile 9 | 0.8135 |
| Decile 8 | 0.689 |
| Decile 7 | 0.6045 |
| Decile 6 | 0.54 |
| Median | 0.484 |
| Decile 4 | 0.424 |
| Decile 3 | 0.3625 |
| Decile 2 | 0.2855 |
| Decile 1 | 0.176 |
| Minimum | -2.387 |
|
|
- Mean = 0.486118
- Std.dev = 0.272878
- 13 items below graph minimum of -0.4615
- 10 items above graph maximum of 1.451
|