Data
84,191 items of data are available, covering 79,645 participants.
Defined-instances run from 2 to 3, labelled using Instancing
2.
Units of measurement are AU.
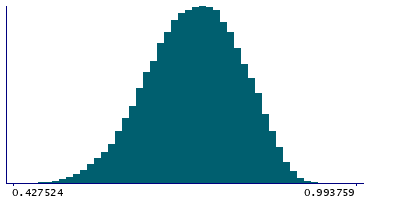
| Maximum | 0.993759 |
| Decile 9 | 0.820021 |
| Decile 8 | 0.788917 |
| Decile 7 | 0.765162 |
| Decile 6 | 0.744001 |
| Median | 0.723305 |
| Decile 4 | 0.702554 |
| Decile 3 | 0.680696 |
| Decile 2 | 0.655096 |
| Decile 1 | 0.620619 |
| Minimum | 0.401391 |
|
|
- Mean = 0.7211
- Std.dev = 0.0761239
- 4 items below graph minimum of 0.421218
|
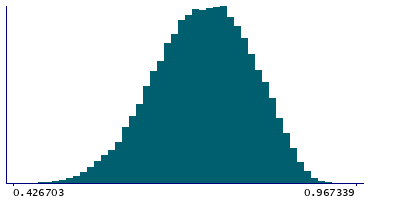
2 Instances
Instance 2 : Imaging visit (2014+)
79,436 participants, 79,436 items
| Maximum | 0.967339 |
| Decile 9 | 0.819989 |
| Decile 8 | 0.78878 |
| Decile 7 | 0.76495 |
| Decile 6 | 0.743764 |
| Median | 0.722909 |
| Decile 4 | 0.702074 |
| Decile 3 | 0.680171 |
| Decile 2 | 0.654524 |
| Decile 1 | 0.620115 |
| Minimum | 0.401391 |
|
|
- Mean = 0.720794
- Std.dev = 0.0762701
- 3 items below graph minimum of 0.420241
|
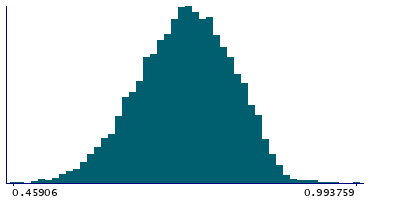
Instance 3 : First repeat imaging visit (2019+)
4,755 participants, 4,755 items
| Maximum | 0.993759 |
| Decile 9 | 0.820415 |
| Decile 8 | 0.791565 |
| Decile 7 | 0.768199 |
| Decile 6 | 0.748248 |
| Median | 0.729437 |
| Decile 4 | 0.710595 |
| Decile 3 | 0.688755 |
| Decile 2 | 0.663823 |
| Decile 1 | 0.629176 |
| Minimum | 0.45906 |
|
|
- Mean = 0.726228
- Std.dev = 0.0734486
|
Notes
Discrepancy between the (EPI-unwarped SBref) rfMRI brain image (linearly-aligned to the T1) and the T1 brain image
0 Related Data-Fields
There are no related data-fields
2 Applications
| Application ID | Title |
|---|
| 17689 | Genetic, environmental and lifestyle predictors of brain/cognitive-related outcomes. |
| 22783 | The joint analysis of imaging data and genetic data for early tumor detection, prevention, diagnosis and treatment |


