Data
70,339 items of data are available, covering 66,478 participants.
Defined-instances run from 2 to 3, labelled using Instancing
2.
Units of measurement are mm.
| Maximum | 2.47364 |
| Decile 9 | 0.236112 |
| Decile 8 | 0.195532 |
| Decile 7 | 0.171776 |
| Decile 6 | 0.154145 |
| Median | 0.139458 |
| Decile 4 | 0.126117 |
| Decile 3 | 0.11386 |
| Decile 2 | 0.101176 |
| Decile 1 | 0.0863302 |
| Minimum | 0.0309172 |
|
|
- Mean = 0.153643
- Std.dev = 0.0688352
- 721 items above graph maximum of 0.385893
|
2 Instances
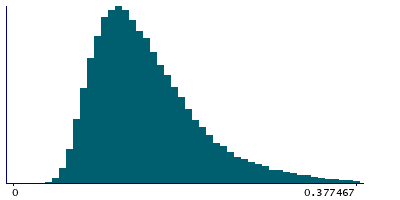
Instance 2 : Imaging visit (2014+)
66,055 participants, 66,055 items
| Maximum | 2.47364 |
| Decile 9 | 0.237196 |
| Decile 8 | 0.196281 |
| Decile 7 | 0.172424 |
| Decile 6 | 0.154682 |
| Median | 0.139918 |
| Decile 4 | 0.126553 |
| Decile 3 | 0.114232 |
| Decile 2 | 0.10142 |
| Decile 1 | 0.0864957 |
| Minimum | 0.0329789 |
|

|
- Mean = 0.154197
- Std.dev = 0.0692789
- 677 items above graph maximum of 0.387896
|
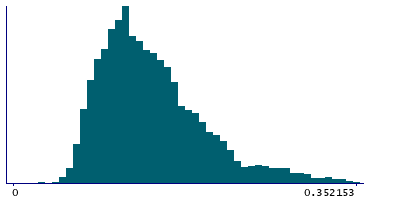
Instance 3 : First repeat imaging visit (2019+)
4,284 participants, 4,284 items
| Maximum | 1.06056 |
| Decile 9 | 0.21798 |
| Decile 8 | 0.184054 |
| Decile 7 | 0.16186 |
| Decile 6 | 0.146667 |
| Median | 0.132909 |
| Decile 4 | 0.119981 |
| Decile 3 | 0.10952 |
| Decile 2 | 0.0979554 |
| Decile 1 | 0.0838067 |
| Minimum | 0.0309172 |
|
|
- Mean = 0.145097
- Std.dev = 0.0609555
- 39 items above graph maximum of 0.352153
|
Notes
Mean tfMRI head motion, averaged across space and time points
0 Related Data-Fields
There are no related data-fields
2 Applications
| Application ID | Title |
|---|
| 17689 | Genetic, environmental and lifestyle predictors of brain/cognitive-related outcomes. |
| 22783 | The joint analysis of imaging data and genetic data for early tumor detection, prevention, diagnosis and treatment |