Data
80,240 items of data are available, covering 80,240 participants.
Defined-instances run from 0 to 1, labelled using Instancing
2.
Units of measurement are micrometres.
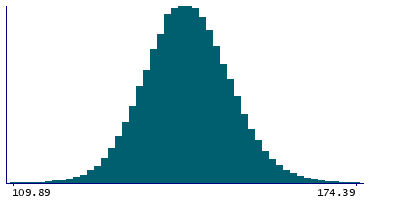
| Maximum | 576.24 |
| Decile 9 | 152.89 |
| Decile 8 | 149.16 |
| Decile 7 | 146.55 |
| Decile 6 | 144.33 |
| Median | 142.24 |
| Decile 4 | 140.16 |
| Decile 3 | 138.01 |
| Decile 2 | 135.37 |
| Decile 1 | 131.39 |
| Minimum | 0 |
|
|
- Mean = 140.531
- Std.dev = 17.7608
- 1764 items below graph minimum of 109.89
- 124 items above graph maximum of 174.39
|
2 Instances
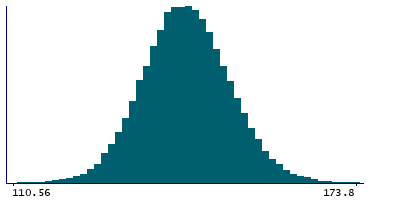
Instance 0 : Initial assessment visit (2006-2010) at which participants were recruited and consent given
65,430 participants, 65,430 items
| Maximum | 576.24 |
| Decile 9 | 152.72 |
| Decile 8 | 149.01 |
| Decile 7 | 146.4 |
| Decile 6 | 144.19 |
| Median | 142.13 |
| Decile 4 | 140.08 |
| Decile 3 | 137.98 |
| Decile 2 | 135.4 |
| Decile 1 | 131.64 |
| Minimum | 0 |
|
|
- Mean = 141.032
- Std.dev = 15.6133
- 970 items below graph minimum of 110.56
- 78 items above graph maximum of 173.8
|
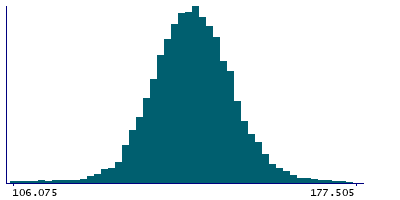
Instance 1 : First repeat assessment visit (2012-13)
14,810 participants, 14,810 items
| Maximum | 277.11 |
| Decile 9 | 153.7 |
| Decile 8 | 149.86 |
| Decile 7 | 147.22 |
| Decile 6 | 144.9 |
| Median | 142.75 |
| Decile 4 | 140.56 |
| Decile 3 | 138.19 |
| Decile 2 | 135.19 |
| Decile 1 | 129.88 |
| Minimum | 0 |
|
|
- Mean = 138.317
- Std.dev = 25.0213
- 777 items below graph minimum of 106.06
- 38 items above graph maximum of 177.52
|
Notes
Average thickness measured between the inner nuclear layer (INL) to the retinal pigment epithelium (RPE) across all subfields in the left eye. The publication detailing the methods can be found in
Publication 1876. Image source for measurements can be found in
Category 100016. Please be aware that these are the raw values generated by the Topcon Advanced Boundary Segmentation [TABS] software and should be quality controlled using the fields in
Category 100116. Please note that these fields have been derived separately from those in
Category 1081. Those wishing to utilise fields across both categories should proceed with additional caution.
0 Related Data-Fields
There are no related data-fields
0 Resources
There are no matching Resources
