Data
82,772 items of data are available, covering 82,772 participants.
Defined-instances run from 0 to 1, labelled using Instancing
2.
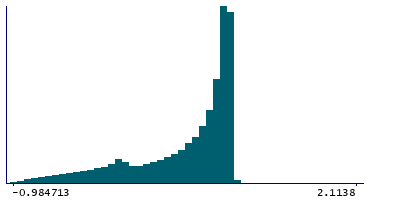
| Maximum | 270 |
| Decile 9 | 0.962361 |
| Decile 8 | 0.936776 |
| Decile 7 | 0.899989 |
| Decile 6 | 0.846268 |
| Median | 0.763895 |
| Decile 4 | 0.641007 |
| Decile 3 | 0.453662 |
| Decile 2 | 0.154937 |
| Decile 1 | -0.189058 |
| Minimum | -0.984713 |
|
|
- Mean = 0.579031
- Std.dev = 2.19805
- 6 items above graph maximum of 2.11378
|
2 Instances
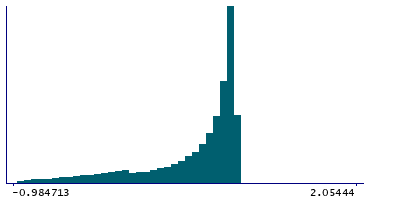
Instance 0 : Initial assessment visit (2006-2010) at which participants were recruited and consent given
67,222 participants, 67,222 items
| Maximum | 270 |
| Decile 9 | 0.964785 |
| Decile 8 | 0.943217 |
| Decile 7 | 0.912303 |
| Decile 6 | 0.868914 |
| Median | 0.803731 |
| Decile 4 | 0.707788 |
| Decile 3 | 0.556867 |
| Decile 2 | 0.294348 |
| Decile 1 | -0.124848 |
| Minimum | -0.984713 |
|
|
- Mean = 0.629373
- Std.dev = 2.42462
- 6 items above graph maximum of 2.05442
|
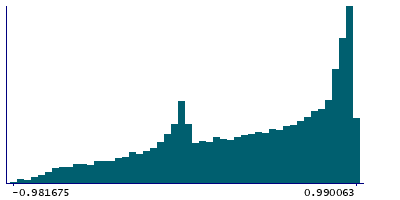
Instance 1 : First repeat assessment visit (2012-13)
15,550 participants, 15,550 items
| Maximum | 0.990063 |
| Decile 9 | 0.934406 |
| Decile 8 | 0.868809 |
| Decile 7 | 0.760585 |
| Decile 6 | 0.620389 |
| Median | 0.450712 |
| Decile 4 | 0.262191 |
| Decile 3 | 0.0500829 |
| Decile 2 | -0.0900338 |
| Decile 1 | -0.359171 |
| Minimum | -0.981675 |
|
|
- Mean = 0.361403
- Std.dev = 0.495468
|
Notes
This field should be used to quality control the values generated by the Topcon Advanced Boundary Segmentation [TABS] software in
Category 100079. Information about how the research group who generated the values quality controlled them for their publication can be seen in
Return 1875.
0 Related Data-Fields
There are no related data-fields
0 Resources
There are no matching Resources
