Data
484,453 items of data are available, covering 467,984 participants.
Defined-instances run from 0 to 1, labelled using Instancing
2.
Units of measurement are g/L.
| Maximum | 2 |
| Decile 9 | 1.342 |
| Decile 8 | 1.224 |
| Decile 7 | 1.144 |
| Decile 6 | 1.078 |
| Median | 1.017 |
| Decile 4 | 0.957 |
| Decile 3 | 0.895 |
| Decile 2 | 0.828 |
| Decile 1 | 0.74 |
| Minimum | 0.4 |
|
|
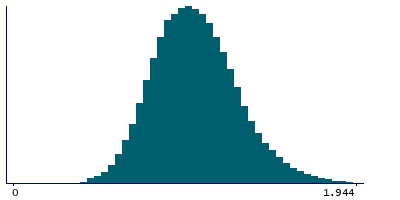
- Mean = 1.03169
- Std.dev = 0.238226
- 164 items above graph maximum of 1.944
|
2 Instances
Instance 0 : Initial assessment visit (2006-2010) at which participants were recruited and consent given
466,683 participants, 466,683 items
| Maximum | 2 |
| Decile 9 | 1.343 |
| Decile 8 | 1.224 |
| Decile 7 | 1.1445 |
| Decile 6 | 1.078 |
| Median | 1.017 |
| Decile 4 | 0.957 |
| Decile 3 | 0.895 |
| Decile 2 | 0.829 |
| Decile 1 | 0.74 |
| Minimum | 0.4 |
|

|
- Mean = 1.03204
- Std.dev = 0.238257
- 152 items above graph maximum of 1.946
|
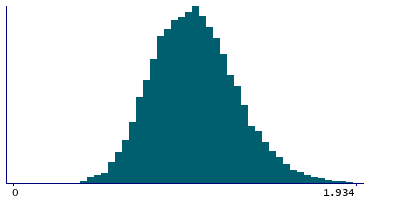
Instance 1 : First repeat assessment visit (2012-13)
17,770 participants, 17,770 items
| Maximum | 1.986 |
| Decile 9 | 1.33 |
| Decile 8 | 1.216 |
| Decile 7 | 1.138 |
| Decile 6 | 1.071 |
| Median | 1.011 |
| Decile 4 | 0.95 |
| Decile 3 | 0.887 |
| Decile 2 | 0.818 |
| Decile 1 | 0.727 |
| Minimum | 0.4 |
|
|
- Mean = 1.02249
- Std.dev = 0.237217
- 5 items above graph maximum of 1.933
|
Notes
Measured by immunoturbidimetric analysis on a Beckman Coulter AU5800
0 Related Data-Fields
There are no related data-fields
6 Applications
| Application ID | Title |
|---|
| 13721 | Causal associations of circulating biomarkers with cardiovascular disease |
| 50016 | Dummy application for biomarker data |
| 48818 | Evaluate the causal effects of diet-modifiable biomarkers on clinical outcomes using Mendelian randomization |
| 45925 | Risk Factors, Biomarkers and Impact of Major Vision-Threatening Eye Diseases |
| 46466 | Serum cardiometabolic and liver function markers in relation to colorectal cancer risk and survival |
| 5167 | The role of serum-based small molecule antioxidants in preventing and predicting age-related phenotypes and respiratory cancer |

