Data
486,659 items of data are available, covering 470,072 participants.
Defined-instances run from 0 to 1, labelled using Instancing
2.
Units of measurement are U/L.
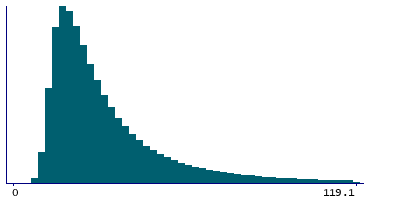
| Maximum | 1184.9 |
| Decile 9 | 66.8 |
| Decile 8 | 46.3 |
| Decile 7 | 36.7 |
| Decile 6 | 30.6 |
| Median | 26.3 |
| Decile 4 | 22.8 |
| Decile 3 | 19.9 |
| Decile 2 | 17.2 |
| Decile 1 | 14.5 |
| Minimum | 5 |
|
|
- Mean = 37.3087
- Std.dev = 41.8774
- 15037 items above graph maximum of 119.1
|
2 Instances
Instance 0 : Initial assessment visit (2006-2010) at which participants were recruited and consent given
468,815 participants, 468,815 items
| Maximum | 1184.9 |
| Decile 9 | 66.9 |
| Decile 8 | 46.4 |
| Decile 7 | 36.8 |
| Decile 6 | 30.7 |
| Median | 26.3 |
| Decile 4 | 22.8 |
| Decile 3 | 19.9 |
| Decile 2 | 17.2 |
| Decile 1 | 14.5 |
| Minimum | 5 |
|

|
- Mean = 37.3937
- Std.dev = 42.0936
- 14546 items above graph maximum of 119.3
|
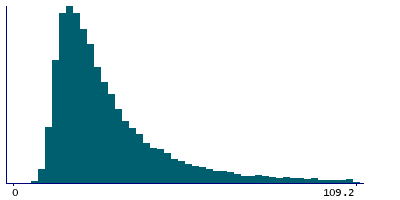
Instance 1 : First repeat assessment visit (2012-13)
17,844 participants, 17,844 items
| Maximum | 1040.4 |
| Decile 9 | 61.9 |
| Decile 8 | 43.6 |
| Decile 7 | 34.9 |
| Decile 6 | 29.5 |
| Median | 25.5 |
| Decile 4 | 22.4 |
| Decile 3 | 19.7 |
| Decile 2 | 17.1 |
| Decile 1 | 14.6 |
| Minimum | 5.1 |
|
|
- Mean = 35.0739
- Std.dev = 35.6596
- 541 items above graph maximum of 109.2
|
Notes
Measured by IFCC analysis on a Beckman Coulter AU5800
0 Related Data-Fields
There are no related data-fields
6 Applications
| Application ID | Title |
|---|
| 13721 | Causal associations of circulating biomarkers with cardiovascular disease |
| 50016 | Dummy application for biomarker data |
| 48818 | Evaluate the causal effects of diet-modifiable biomarkers on clinical outcomes using Mendelian randomization |
| 45925 | Risk Factors, Biomarkers and Impact of Major Vision-Threatening Eye Diseases |
| 46466 | Serum cardiometabolic and liver function markers in relation to colorectal cancer risk and survival |
| 5167 | The role of serum-based small molecule antioxidants in preventing and predicting age-related phenotypes and respiratory cancer |

