Data
486,513 items of data are available, covering 469,945 participants.
Defined-instances run from 0 to 1, labelled using Instancing
2.
Units of measurement are mmol/L.
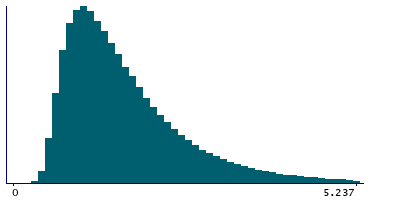
| Maximum | 11.278 |
| Decile 9 | 3.015 |
| Decile 8 | 2.354 |
| Decile 7 | 1.973 |
| Decile 6 | 1.701 |
| Median | 1.482 |
| Decile 4 | 1.295 |
| Decile 3 | 1.126 |
| Decile 2 | 0.966 |
| Decile 1 | 0.791 |
| Minimum | 0.231 |
|
|
- Mean = 1.7459
- Std.dev = 1.0245
- 5892 items above graph maximum of 5.239
|
2 Instances
Instance 0 : Initial assessment visit (2006-2010) at which participants were recruited and consent given
468,688 participants, 468,688 items
| Maximum | 11.278 |
| Decile 9 | 3.021 |
| Decile 8 | 2.358 |
| Decile 7 | 1.976 |
| Decile 6 | 1.702 |
| Median | 1.483 |
| Decile 4 | 1.294 |
| Decile 3 | 1.126 |
| Decile 2 | 0.965 |
| Decile 1 | 0.79 |
| Minimum | 0.231 |
|

|
- Mean = 1.74771
- Std.dev = 1.02775
- 5692 items above graph maximum of 5.252
|
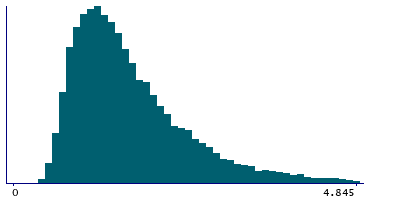
Instance 1 : First repeat assessment visit (2012-13)
17,825 participants, 17,825 items
| Maximum | 11.076 |
| Decile 9 | 2.833 |
| Decile 8 | 2.252 |
| Decile 7 | 1.909 |
| Decile 6 | 1.656 |
| Median | 1.462 |
| Decile 4 | 1.296 |
| Decile 3 | 1.143 |
| Decile 2 | 0.988 |
| Decile 1 | 0.8205 |
| Minimum | 0.28 |
|
|
- Mean = 1.69819
- Std.dev = 0.933929
- 219 items above graph maximum of 4.8455
|
Notes
Measured by GPO-POD analysis on a Beckman Coulter AU5800
0 Related Data-Fields
There are no related data-fields
6 Applications
| Application ID | Title |
|---|
| 13721 | Causal associations of circulating biomarkers with cardiovascular disease |
| 50016 | Dummy application for biomarker data |
| 48818 | Evaluate the causal effects of diet-modifiable biomarkers on clinical outcomes using Mendelian randomization |
| 45925 | Risk Factors, Biomarkers and Impact of Major Vision-Threatening Eye Diseases |
| 46466 | Serum cardiometabolic and liver function markers in relation to colorectal cancer risk and survival |
| 5167 | The role of serum-based small molecule antioxidants in preventing and predicting age-related phenotypes and respiratory cancer |

