Data
484,491 items of data are available, covering 467,957 participants.
Defined-instances run from 0 to 1, labelled using Instancing
2.
Units of measurement are factor.
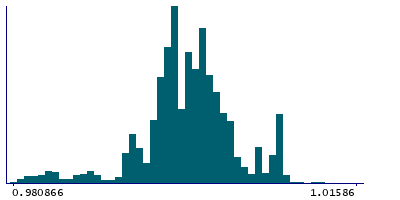
| Maximum | 1.06444 |
| Decile 9 | 1.0042 |
| Decile 8 | 1.00175 |
| Decile 7 | 1.00052 |
| Decile 6 | 0.999694 |
| Median | 0.998729 |
| Decile 4 | 0.997299 |
| Decile 3 | 0.996707 |
| Decile 2 | 0.995535 |
| Decile 1 | 0.992531 |
| Minimum | 0.867682 |
|
|
- Mean = 0.996999
- Std.dev = 0.0106864
- 14877 items below graph minimum of 0.980866
- 3 items above graph maximum of 1.01586
|
2 Instances
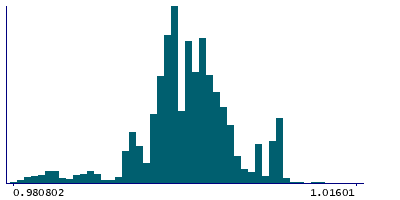
Instance 0 : Initial assessment visit (2006-2010) at which participants were recruited and consent given
466,613 participants, 466,613 items
| Maximum | 1.06444 |
| Decile 9 | 1.00427 |
| Decile 8 | 1.00179 |
| Decile 7 | 1.00056 |
| Decile 6 | 0.999649 |
| Median | 0.998729 |
| Decile 4 | 0.99728 |
| Decile 3 | 0.996705 |
| Decile 2 | 0.995535 |
| Decile 1 | 0.992539 |
| Minimum | 0.890345 |
|
|
- Mean = 0.997069
- Std.dev = 0.0105689
- 13836 items below graph minimum of 0.980802
- 1 item above graph maximum of 1.01601
|
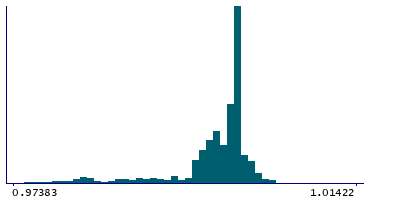
Instance 1 : First repeat assessment visit (2012-13)
17,878 participants, 17,878 items
| Maximum | 1.01849 |
| Decile 9 | 1.00076 |
| Decile 8 | 1 |
| Decile 7 | 1 |
| Decile 6 | 1 |
| Median | 0.99937 |
| Decile 4 | 0.998028 |
| Decile 3 | 0.997028 |
| Decile 2 | 0.995631 |
| Decile 1 | 0.987294 |
| Minimum | 0.867682 |
|
|
- Mean = 0.995185
- Std.dev = 0.0132653
- 746 items below graph minimum of 0.97383
- 2 items above graph maximum of 1.01422
|
Notes
Average estimated dilution factor across assays.
0 Related Data-Fields
There are no related data-fields
4 Applications
| Application ID | Title |
|---|
| 50016 | Dummy application for biomarker data |
| 45925 | Risk Factors, Biomarkers and Impact of Major Vision-Threatening Eye Diseases |
| 52217 | Serum cardiometabolic biomarkers in relation to all-cause and cause-specific mortality |
| 40086 | The association of type 2 diabetes and HbA1c with subsequent risk of cancer at different anatomical sites |

