Data
43,273 items of data are available, covering 40,746 participants.
Defined-instances run from 2 to 3, labelled using Instancing
2.
Units of measurement are percent.
| Maximum | 44.3 |
| Decile 9 | 10.6 |
| Decile 8 | 6.5 |
| Decile 7 | 4.6 |
| Decile 6 | 3.6 |
| Median | 3.1 |
| Decile 4 | 2.6 |
| Decile 3 | 2.3 |
| Decile 2 | 2 |
| Decile 1 | 1.7 |
| Minimum | 0.7 |
|

|
- Mean = 4.91351
- Std.dev = 4.91451
- 1146 items above graph maximum of 19.5
|
2 Instances
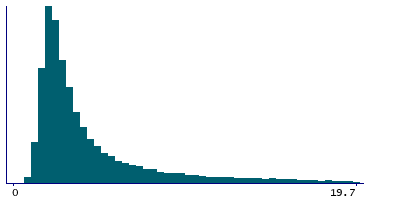
Instance 2 : Imaging visit (2014+)
40,483 participants, 40,483 items
| Maximum | 44.3 |
| Decile 9 | 10.7 |
| Decile 8 | 6.5 |
| Decile 7 | 4.6 |
| Decile 6 | 3.7 |
| Median | 3.1 |
| Decile 4 | 2.6 |
| Decile 3 | 2.3 |
| Decile 2 | 2 |
| Decile 1 | 1.7 |
| Minimum | 0.7 |
|
|
- Mean = 4.9146
- Std.dev = 4.92045
- 1063 items above graph maximum of 19.7
|
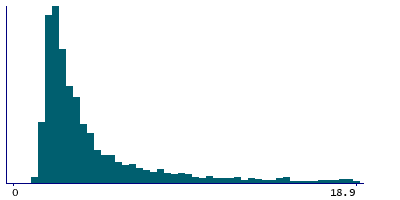
Instance 3 : First repeat imaging visit (2019+)
2,790 participants, 2,790 items
| Maximum | 43.9 |
| Decile 9 | 10.4 |
| Decile 8 | 6.3 |
| Decile 7 | 4.5 |
| Decile 6 | 3.6 |
| Median | 3.1 |
| Decile 4 | 2.7 |
| Decile 3 | 2.4 |
| Decile 2 | 2.1 |
| Decile 1 | 1.9 |
| Minimum | 1.2 |
|
|
- Mean = 4.89771
- Std.dev = 4.82748
- 75 items above graph maximum of 18.9
|
Notes
Liver fat percentage is defined as : fat / ( water + fat )
Derived variable provided by Perspectum (application #9914). See the following publications:
Wilman HR, Kelly M, Garratt S, et al. (2017) Characterisation of liver fat in the UK Biobank cohort. PLoS ONE 12(2): e0172921. doi:10.1371/journal.pone.0172921
Parisinos CA, Wilman HR, Thomas EL, et al. (2020) Genome-wide and Mendelian randomisation studies of liver MRI yield insights into the pathogenesis of steatohepatitis. J Hepatol. 73(2):241-251. doi: 10.1016/j.jhep.2020.03.032
1 Related Data-Field
| Field ID | Description | Relationship |
|---|
| 40063 | Acquisition protocol | Field 40063 gives the MRI acquisition protocol used to derive Current Field |
0 Resources
There are no matching Resources
