Data
218,589 items of data are available, covering 196,562 participants.
Defined-instances run from 0 to 3, labelled using Instancing
2.
Units of measurement are Std.Devs.
| Maximum | 8.412 |
| Decile 9 | 1.1821 |
| Decile 8 | 0.56 |
| Decile 7 | 0.162 |
| Decile 6 | -0.154732 |
| Median | -0.433 |
| Decile 4 | -0.701996 |
| Decile 3 | -0.978 |
| Decile 2 | -1.28443 |
| Decile 1 | -1.687 |
| Minimum | -5.63916 |
|

|
- Mean = -0.29975
- Std.dev = 1.29536
- 442 items below graph minimum of -4.5561
- 2016 items above graph maximum of 4.0512
|
4 Instances
Instance 0 : Initial assessment visit (2006-2010) at which participants were recruited and consent given
164,016 participants, 164,016 items
| Maximum | 8.412 |
| Decile 9 | 1.1795 |
| Decile 8 | 0.551 |
| Decile 7 | 0.15 |
| Decile 6 | -0.166 |
| Median | -0.444 |
| Decile 4 | -0.711 |
| Decile 3 | -0.986 |
| Decile 2 | -1.293 |
| Decile 1 | -1.692 |
| Minimum | -5.634 |
|

|
- Mean = -0.302624
- Std.dev = 1.31006
- 306 items below graph minimum of -4.5635
- 1675 items above graph maximum of 4.051
|
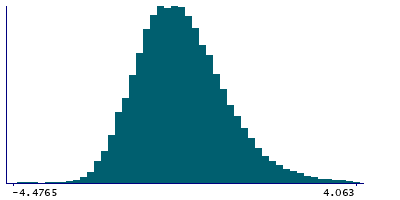
Instance 1 : First repeat assessment visit (2012-13)
19,794 participants, 19,794 items
| Maximum | 8.377 |
| Decile 9 | 1.2155 |
| Decile 8 | 0.61 |
| Decile 7 | 0.2245 |
| Decile 6 | -0.094 |
| Median | -0.372 |
| Decile 4 | -0.652 |
| Decile 3 | -0.922 |
| Decile 2 | -1.222 |
| Decile 1 | -1.63 |
| Minimum | -5.608 |
|
|
- Mean = -0.262252
- Std.dev = 1.24296
- 58 items below graph minimum of -4.4755
- 125 items above graph maximum of 4.061
|
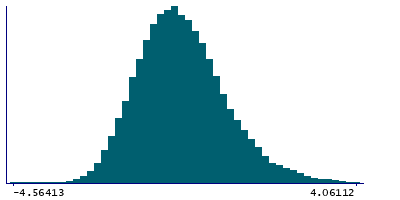
Instance 2 : Imaging visit (2014+)
34,395 participants, 34,395 items
| Maximum | 8.40961 |
| Decile 9 | 1.18579 |
| Decile 8 | 0.570214 |
| Decile 7 | 0.182763 |
| Decile 6 | -0.132848 |
| Median | -0.417871 |
| Decile 4 | -0.682768 |
| Decile 3 | -0.965353 |
| Decile 2 | -1.28104 |
| Decile 1 | -1.68904 |
| Minimum | -5.63916 |
|
|
- Mean = -0.306818
- Std.dev = 1.25492
- 82 items below graph minimum of -4.56387
- 213 items above graph maximum of 4.06062
|
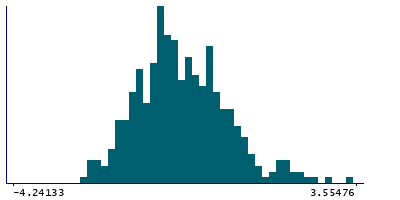
Instance 3 : First repeat imaging visit (2019+)
384 participants, 384 items
| Maximum | 6.55966 |
| Decile 9 | 0.956063 |
| Decile 8 | 0.442647 |
| Decile 7 | 0.121491 |
| Decile 6 | -0.199406 |
| Median | -0.506366 |
| Decile 4 | -0.771156 |
| Decile 3 | -0.948187 |
| Decile 2 | -1.31029 |
| Decile 1 | -1.64263 |
| Minimum | -4.47309 |
|
|
- Mean = -0.372245
- Std.dev = 1.14947
- 1 item below graph minimum of -4.24133
- 3 items above graph maximum of 3.55476
|


