Data
218,925 items of data are available, covering 196,731 participants.
Defined-instances run from 0 to 3, labelled using Instancing
2.
Units of measurement are m/s.
| Maximum | 1799.93 |
| Decile 9 | 1599.48 |
| Decile 8 | 1581.38 |
| Decile 7 | 1569.76 |
| Decile 6 | 1560.38 |
| Median | 1552.19 |
| Decile 4 | 1544.26 |
| Decile 3 | 1536.41 |
| Decile 2 | 1527.58 |
| Decile 1 | 1516.21 |
| Minimum | 1400.05 |
|
|
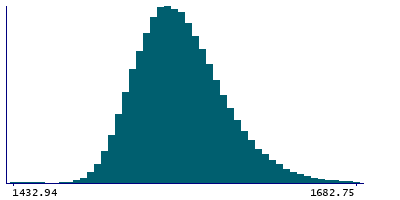
- Mean = 1556.07
- Std.dev = 36.891
- 535 items below graph minimum of 1432.94
- 1754 items above graph maximum of 1682.75
|
4 Instances
Instance 0 : Initial assessment visit (2006-2010) at which participants were recruited and consent given
164,025 participants, 164,025 items
| Maximum | 1799.93 |
| Decile 9 | 1599.14 |
| Decile 8 | 1580.96 |
| Decile 7 | 1569.36 |
| Decile 6 | 1559.96 |
| Median | 1551.8 |
| Decile 4 | 1543.93 |
| Decile 3 | 1536.08 |
| Decile 2 | 1527.29 |
| Decile 1 | 1516.05 |
| Minimum | 1400.05 |
|
|
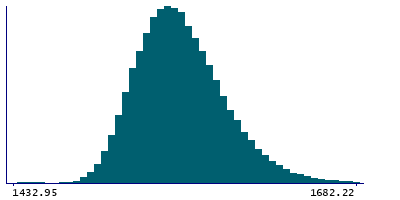
- Mean = 1555.85
- Std.dev = 37.1713
- 395 items below graph minimum of 1432.96
- 1435 items above graph maximum of 1682.22
|
Instance 1 : First repeat assessment visit (2012-13)
19,890 participants, 19,890 items
| Maximum | 1799.8 |
| Decile 9 | 1601.98 |
| Decile 8 | 1583.75 |
| Decile 7 | 1572.27 |
| Decile 6 | 1562.69 |
| Median | 1554.46 |
| Decile 4 | 1546.05 |
| Decile 3 | 1538.22 |
| Decile 2 | 1529.32 |
| Decile 1 | 1517.76 |
| Minimum | 1400.19 |
|
|
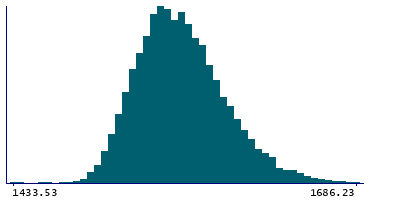
- Mean = 1557.91
- Std.dev = 36.0809
- 46 items below graph minimum of 1433.54
- 125 items above graph maximum of 1686.2
|
Instance 2 : Imaging visit (2014+)
34,622 participants, 34,622 items
| Maximum | 1797.99 |
| Decile 9 | 1599.75 |
| Decile 8 | 1581.91 |
| Decile 7 | 1570.32 |
| Decile 6 | 1561.15 |
| Median | 1552.95 |
| Decile 4 | 1544.81 |
| Decile 3 | 1536.94 |
| Decile 2 | 1527.86 |
| Decile 1 | 1516.07 |
| Minimum | 1400.48 |
|
|
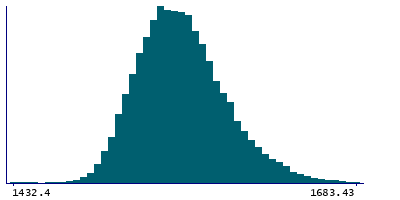
- Mean = 1556.09
- Std.dev = 36.0274
- 94 items below graph minimum of 1432.39
- 194 items above graph maximum of 1683.43
|
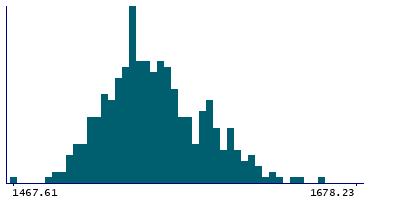
Instance 3 : First repeat imaging visit (2019+)
388 participants, 388 items
| Maximum | 1788.22 |
| Decile 9 | 1597.67 |
| Decile 8 | 1582.96 |
| Decile 7 | 1567.49 |
| Decile 6 | 1558.57 |
| Median | 1550.86 |
| Decile 4 | 1542.86 |
| Decile 3 | 1537.85 |
| Decile 2 | 1529.27 |
| Decile 1 | 1517.1 |
| Minimum | 1467.61 |
|
|
- Mean = 1554.61
- Std.dev = 32.2608
- 1 item above graph maximum of 1678.23
|


