Data
4,529,357 items of data are available, covering 240,260 participants.
Defined-instances run from 0 to 3, labelled using Instancing
2.
Array indices run from 1 to 15.
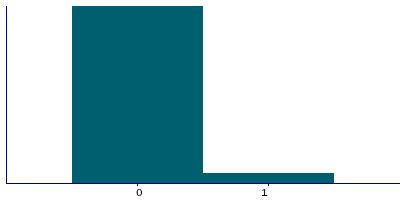
| Maximum | 69 |
| Decile 9 | 0 |
| Decile 8 | 0 |
| Decile 7 | 0 |
| Decile 6 | 0 |
| Median | 0 |
| Decile 4 | 0 |
| Decile 3 | 0 |
| Decile 2 | 0 |
| Decile 1 | 0 |
| Minimum | 0 |
|
|
- There are 40 distinct values.
- Mean = 0.0960916
- Std.dev = 0.469738
- 67866 items above graph maximum of 1
|
4 Instances
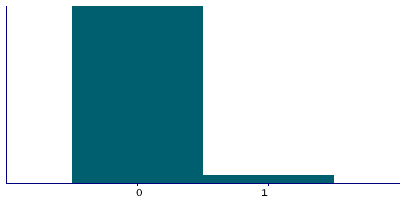
Instance 0 : Initial assessment visit (2006-2010) at which participants were recruited and consent given
166,118 participants, 2,459,885 items
| Maximum | 67 |
| Decile 9 | 0 |
| Decile 8 | 0 |
| Decile 7 | 0 |
| Decile 6 | 0 |
| Median | 0 |
| Decile 4 | 0 |
| Decile 3 | 0 |
| Decile 2 | 0 |
| Decile 1 | 0 |
| Minimum | 0 |
|
|
- There are 38 distinct values.
- Mean = 0.0877431
- Std.dev = 0.493052
- 38319 items above graph maximum of 1
|
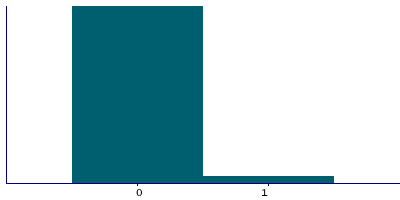
Instance 1 : First repeat assessment visit (2012-13)
20,003 participants, 297,858 items
| Maximum | 28 |
| Decile 9 | 0 |
| Decile 8 | 0 |
| Decile 7 | 0 |
| Decile 6 | 0 |
| Median | 0 |
| Decile 4 | 0 |
| Decile 3 | 0 |
| Decile 2 | 0 |
| Decile 1 | 0 |
| Minimum | 0 |
|
|
- There are 22 distinct values.
- Mean = 0.0754151
- Std.dev = 0.429379
- 3812 items above graph maximum of 1
|
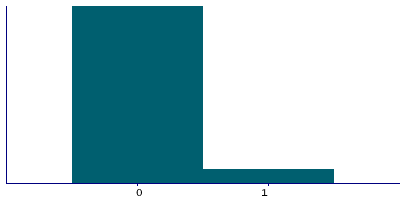
Instance 2 : Imaging visit (2014+)
98,743 participants, 1,464,984 items
| Maximum | 69 |
| Decile 9 | 0 |
| Decile 8 | 0 |
| Decile 7 | 0 |
| Decile 6 | 0 |
| Median | 0 |
| Decile 4 | 0 |
| Decile 3 | 0 |
| Decile 2 | 0 |
| Decile 1 | 0 |
| Minimum | 0 |
|
|
- There are 27 distinct values.
- Mean = 0.11203
- Std.dev = 0.444756
- 21500 items above graph maximum of 1
|
Instance 3 : First repeat imaging visit (2019+)
20,557 participants, 306,630 items
| Maximum | 26 |
| Decile 9 | 0 |
| Decile 8 | 0 |
| Decile 7 | 0 |
| Decile 6 | 0 |
| Median | 0 |
| Decile 4 | 0 |
| Decile 3 | 0 |
| Decile 2 | 0 |
| Decile 1 | 0 |
| Minimum | 0 |
|

|
- There are 20 distinct values.
- Mean = 0.107002
- Std.dev = 0.427404
- 4235 items above graph maximum of 1
|


