Data
307,541 items of data are available, covering 241,865 participants.
Defined-instances run from 0 to 3, labelled using Instancing
2.
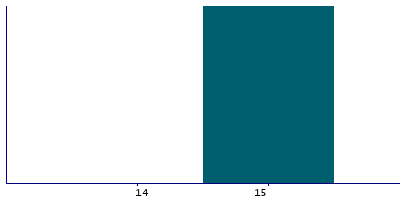
| Maximum | 15 |
| Decile 9 | 15 |
| Decile 8 | 15 |
| Decile 7 | 15 |
| Decile 6 | 15 |
| Median | 15 |
| Decile 4 | 15 |
| Decile 3 | 15 |
| Decile 2 | 15 |
| Decile 1 | 15 |
| Minimum | 0 |
|

|
- There are 16 distinct values.
- Mean = 14.7276
- Std.dev = 1.87547
- 6682 items below graph minimum of 14
|
4 Instances
Instance 0 : Initial assessment visit (2006-2010) at which participants were recruited and consent given
167,751 participants, 167,751 items
| Maximum | 15 |
| Decile 9 | 15 |
| Decile 8 | 15 |
| Decile 7 | 15 |
| Decile 6 | 15 |
| Median | 15 |
| Decile 4 | 15 |
| Decile 3 | 15 |
| Decile 2 | 15 |
| Decile 1 | 15 |
| Minimum | 0 |
|

|
- There are 16 distinct values.
- Mean = 14.6639
- Std.dev = 2.07708
- 4510 items below graph minimum of 14
|
Instance 1 : First repeat assessment visit (2012-13)
20,029 participants, 20,029 items
| Maximum | 15 |
| Decile 9 | 15 |
| Decile 8 | 15 |
| Decile 7 | 15 |
| Decile 6 | 15 |
| Median | 15 |
| Decile 4 | 15 |
| Decile 3 | 15 |
| Decile 2 | 15 |
| Decile 1 | 15 |
| Minimum | 0 |
|
|
- There are 15 distinct values.
- Mean = 14.8713
- Std.dev = 1.27315
- 212 items below graph minimum of 14
|
Instance 2 : Imaging visit (2014+)
99,151 participants, 99,151 items
| Maximum | 15 |
| Decile 9 | 15 |
| Decile 8 | 15 |
| Decile 7 | 15 |
| Decile 6 | 15 |
| Median | 15 |
| Decile 4 | 15 |
| Decile 3 | 15 |
| Decile 2 | 15 |
| Decile 1 | 15 |
| Minimum | 0 |
|

|
- There are 16 distinct values.
- Mean = 14.7751
- Std.dev = 1.71591
- 1749 items below graph minimum of 14
|
Instance 3 : First repeat imaging visit (2019+)
20,610 participants, 20,610 items
| Maximum | 15 |
| Decile 9 | 15 |
| Decile 8 | 15 |
| Decile 7 | 15 |
| Decile 6 | 15 |
| Median | 15 |
| Decile 4 | 15 |
| Decile 3 | 15 |
| Decile 2 | 15 |
| Decile 1 | 15 |
| Minimum | 0 |
|

|
- There are 15 distinct values.
- Mean = 14.8777
- Std.dev = 1.24281
- 211 items below graph minimum of 14
|


