Data
176,018 items of data are available, covering 67,098 participants.
Defined-instances run from 0 to 1, labelled using Instancing
2.
Array indices run from 0 to 5.
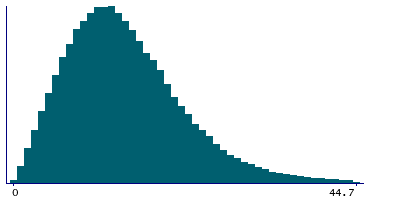
| Maximum | 287.6 |
| Decile 9 | 25.2 |
| Decile 8 | 20.6 |
| Decile 7 | 17.8 |
| Decile 6 | 15.5 |
| Median | 13.6 |
| Decile 4 | 11.8 |
| Decile 3 | 10 |
| Decile 2 | 8 |
| Decile 1 | 5.7 |
| Minimum | 0.1 |
|
|
- Mean = 15.127
- Std.dev = 10.1208
- 1960 items above graph maximum of 44.7
|
2 Instances
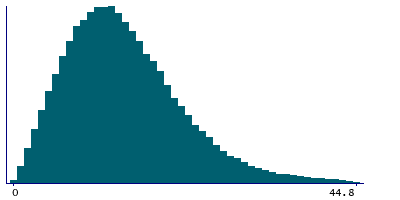
Instance 0 : Initial assessment visit (2006-2010) at which participants were recruited and consent given
59,353 participants, 152,423 items
| Maximum | 287.6 |
| Decile 9 | 25.2 |
| Decile 8 | 20.5 |
| Decile 7 | 17.7 |
| Decile 6 | 15.5 |
| Median | 13.5 |
| Decile 4 | 11.7 |
| Decile 3 | 9.9 |
| Decile 2 | 8 |
| Decile 1 | 5.6 |
| Minimum | 0.1 |
|
|
- Mean = 15.089
- Std.dev = 10.2094
- 1723 items above graph maximum of 44.8
|
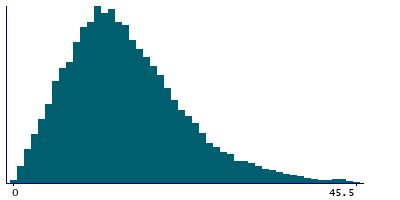
Instance 1 : First repeat assessment visit (2012-13)
9,184 participants, 23,595 items
| Maximum | 182.6 |
| Decile 9 | 25.7 |
| Decile 8 | 21 |
| Decile 7 | 18.1 |
| Decile 6 | 15.9 |
| Median | 13.9 |
| Decile 4 | 12.1 |
| Decile 3 | 10.4 |
| Decile 2 | 8.4 |
| Decile 1 | 5.9 |
| Minimum | 0.1 |
|
|
- Mean = 15.3725
- Std.dev = 9.5253
- 216 items above graph maximum of 45.5
|
Notes
This is the asymmetry index as part of the keratometry result taken at 6mm for the right eye
1 Related Data-Field
| Field ID | Description | Relationship |
|---|
| 5157 | 6mm asymmetry index (left) | Field 5157 is the opposite-side complement to Current Field |


