Data
176,512 items of data are available, covering 67,200 participants.
Defined-instances run from 0 to 1, labelled using Instancing
2.
Array indices run from 0 to 5.
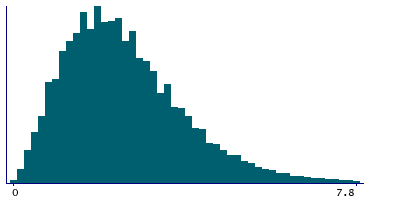
| Maximum | 76.2 |
| Decile 9 | 4.4 |
| Decile 8 | 3.6 |
| Decile 7 | 3.1 |
| Decile 6 | 2.7 |
| Median | 2.3 |
| Decile 4 | 2 |
| Decile 3 | 1.7 |
| Decile 2 | 1.4 |
| Decile 1 | 1 |
| Minimum | 0 |
|
|
- Mean = 2.60764
- Std.dev = 1.74863
- 1584 items above graph maximum of 7.8
|
2 Instances
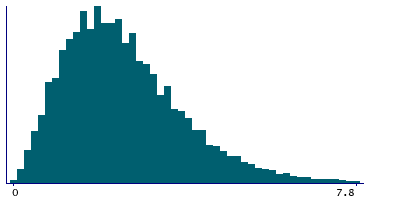
Instance 0 : Initial assessment visit (2006-2010) at which participants were recruited and consent given
59,447 participants, 152,847 items
| Maximum | 76.2 |
| Decile 9 | 4.4 |
| Decile 8 | 3.6 |
| Decile 7 | 3.1 |
| Decile 6 | 2.7 |
| Median | 2.3 |
| Decile 4 | 2 |
| Decile 3 | 1.7 |
| Decile 2 | 1.4 |
| Decile 1 | 1 |
| Minimum | 0 |
|
|
- Mean = 2.58508
- Std.dev = 1.75792
- 1336 items above graph maximum of 7.8
|
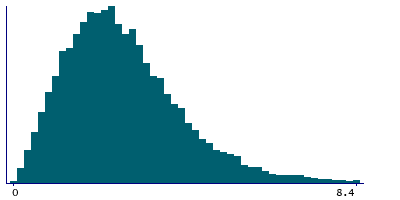
Instance 1 : First repeat assessment visit (2012-13)
9,195 participants, 23,665 items
| Maximum | 52.2 |
| Decile 9 | 4.7 |
| Decile 8 | 3.8 |
| Decile 7 | 3.3 |
| Decile 6 | 2.9 |
| Median | 2.5 |
| Decile 4 | 2.2 |
| Decile 3 | 1.8 |
| Decile 2 | 1.5 |
| Decile 1 | 1 |
| Minimum | 0 |
|
|
- Mean = 2.75338
- Std.dev = 1.68007
- 173 items above graph maximum of 8.4
|
Notes
This is the regularity index as part of the keratometry result taken at 6mm for the right eye
1 Related Data-Field
| Field ID | Description | Relationship |
|---|
| 5162 | 6mm regularity index (left) | Field 5162 is the opposite-side complement to Current Field |


