Data
137,192 items of data are available, covering 132,976 participants.
Defined-instances run from 0 to 1, labelled using Instancing
2.
| Maximum | 5 |
| Decile 9 | 5 |
| Decile 8 | 5 |
| Decile 7 | 5 |
| Decile 6 | 5 |
| Median | 5 |
| Decile 4 | 5 |
| Decile 3 | 5 |
| Decile 2 | 5 |
| Decile 1 | 5 |
| Minimum | 2 |
|

|
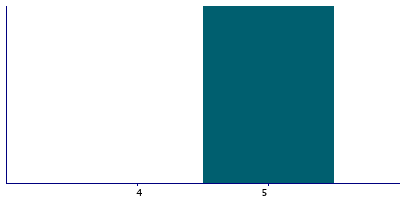
- There are 4 distinct values.
- Mean = 4.98573
- Std.dev = 0.188061
- 637 items below graph minimum of 4
|
2 Instances
Instance 0 : Initial assessment visit (2006-2010) at which participants were recruited and consent given
117,012 participants, 117,012 items
| Maximum | 5 |
| Decile 9 | 5 |
| Decile 8 | 5 |
| Decile 7 | 5 |
| Decile 6 | 5 |
| Median | 5 |
| Decile 4 | 5 |
| Decile 3 | 5 |
| Decile 2 | 5 |
| Decile 1 | 5 |
| Minimum | 2 |
|

|
- There are 4 distinct values.
- Mean = 4.98561
- Std.dev = 0.189632
- 548 items below graph minimum of 4
|
Instance 1 : First repeat assessment visit (2012-13)
20,180 participants, 20,180 items
| Maximum | 5 |
| Decile 9 | 5 |
| Decile 8 | 5 |
| Decile 7 | 5 |
| Decile 6 | 5 |
| Median | 5 |
| Decile 4 | 5 |
| Decile 3 | 5 |
| Decile 2 | 5 |
| Decile 1 | 5 |
| Minimum | 2 |
|
|
- There are 4 distinct values.
- Mean = 4.98642
- Std.dev = 0.17868
- 89 items below graph minimum of 4
|


