Data
137,133 items of data are available, covering 132,921 participants.
Defined-instances run from 0 to 1, labelled using Instancing
2.
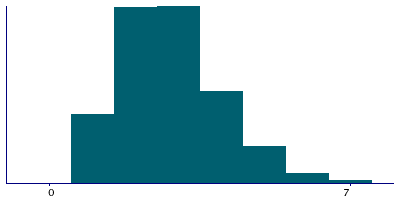
| Maximum | 16 |
| Decile 9 | 4 |
| Decile 8 | 4 |
| Decile 7 | 3 |
| Decile 6 | 3 |
| Median | 3 |
| Decile 4 | 2 |
| Decile 3 | 2 |
| Decile 2 | 2 |
| Decile 1 | 1 |
| Minimum | 1 |
|
|
- There are 16 distinct values.
- Mean = 2.85421
- Std.dev = 1.32819
- 922 items above graph maximum of 7
|
2 Instances
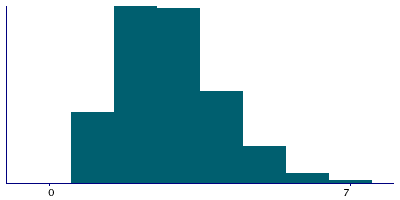
Instance 0 : Initial assessment visit (2006-2010) at which participants were recruited and consent given
116,954 participants, 116,954 items
| Maximum | 16 |
| Decile 9 | 4 |
| Decile 8 | 4 |
| Decile 7 | 3 |
| Decile 6 | 3 |
| Median | 3 |
| Decile 4 | 2 |
| Decile 3 | 2 |
| Decile 2 | 2 |
| Decile 1 | 1 |
| Minimum | 1 |
|
|
- There are 16 distinct values.
- Mean = 2.84719
- Std.dev = 1.32749
- 763 items above graph maximum of 7
|
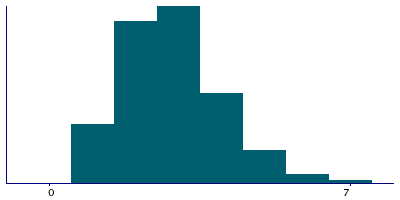
Instance 1 : First repeat assessment visit (2012-13)
20,179 participants, 20,179 items
| Maximum | 16 |
| Decile 9 | 4 |
| Decile 8 | 4 |
| Decile 7 | 3 |
| Decile 6 | 3 |
| Median | 3 |
| Decile 4 | 2 |
| Decile 3 | 2 |
| Decile 2 | 2 |
| Decile 1 | 1 |
| Minimum | 1 |
|
|
- There are 16 distinct values.
- Mean = 2.89489
- Std.dev = 1.33152
- 159 items above graph maximum of 7
|


