Data
16,794 items of data are available, covering 16,113 participants.
Defined-instances run from 2 to 3, labelled using Instancing
2.
Units of measurement are dioptre.
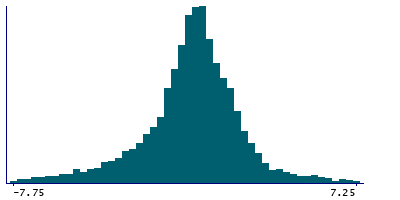
| Maximum | 11.5 |
| Decile 9 | 2.25 |
| Decile 8 | 1.5 |
| Decile 7 | 1 |
| Decile 6 | 0.5 |
| Median | 0.25 |
| Decile 4 | -0.25 |
| Decile 3 | -0.75 |
| Decile 2 | -1.5 |
| Decile 1 | -3 |
| Minimum | -20.75 |
|
|
- Mean = -0.0610337
- Std.dev = 2.41957
- 127 items below graph minimum of -8.25
- 48 items above graph maximum of 7.5
|
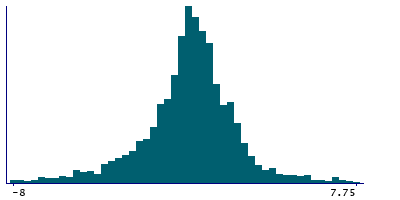
2 Instances
Instance 2 : Imaging visit (2014+)
3,492 participants, 3,492 items
| Maximum | 9.25 |
| Decile 9 | 2.5 |
| Decile 8 | 1.5 |
| Decile 7 | 1 |
| Decile 6 | 0.5 |
| Median | 0.25 |
| Decile 4 | -0.25 |
| Decile 3 | -0.75 |
| Decile 2 | -1.25 |
| Decile 1 | -2.75 |
| Minimum | -16.75 |
|
|
- Mean = -0.0132446
- Std.dev = 2.45124
- 35 items below graph minimum of -8
- 10 items above graph maximum of 7.75
|
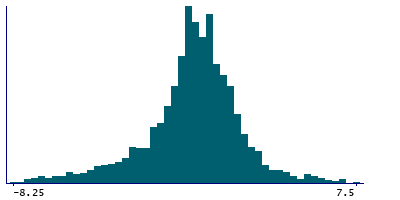
Instance 3 : First repeat imaging visit (2019+)
13,302 participants, 13,302 items
| Maximum | 11.5 |
| Decile 9 | 2.25 |
| Decile 8 | 1.5 |
| Decile 7 | 1 |
| Decile 6 | 0.5 |
| Median | 0.25 |
| Decile 4 | -0.25 |
| Decile 3 | -0.75 |
| Decile 2 | -1.5 |
| Decile 1 | -3 |
| Minimum | -20.75 |
|
|
- Mean = -0.0735792
- Std.dev = 2.41103
- 97 items below graph minimum of -8.25
- 36 items above graph maximum of 7.5
|
Notes
Median spherical equivalent value (right)
0 Related Data-Fields
There are no related data-fields
0 Resources
There are no matching Resources
