Data
639,426 items of data are available, covering 498,506 participants.
Some values have special meanings defined by Data-Coding
100373.
Defined-instances run from 0 to 3, labelled using Instancing
2.
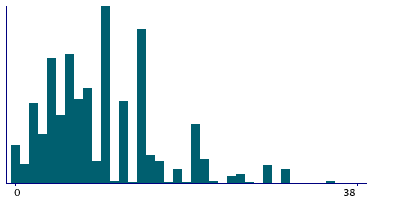
Units of measurement are slices/week.
| Maximum | 200 |
| Decile 9 | 21 |
| Decile 8 | 18 |
| Decile 7 | 14 |
| Decile 6 | 12 |
| Median | 10 |
| Decile 4 | 8 |
| Decile 3 | 7 |
| Decile 2 | 5 |
| Decile 1 | 3 |
| Minimum | 0 |
|
|
- There are 95 distinct values.
- Mean = 11.9201
- Std.dev = 8.32512
- 8198 items above graph maximum of 39
- 8244 items have value -10 (Less than one)
- 451 items have value -3 (Prefer not to answer)
- 6387 items have value -1 (Do not know)
|
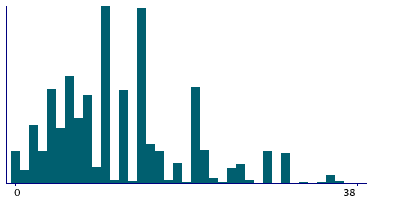
4 Instances
Instance 0 : Initial assessment visit (2006-2010) at which participants were recruited and consent given
497,275 participants, 497,275 items
| Maximum | 200 |
| Decile 9 | 24 |
| Decile 8 | 20 |
| Decile 7 | 14 |
| Decile 6 | 14 |
| Median | 10 |
| Decile 4 | 10 |
| Decile 3 | 7 |
| Decile 2 | 6 |
| Decile 1 | 4 |
| Minimum | 0 |
|
|
- There are 92 distinct values.
- Mean = 12.4081
- Std.dev = 8.57151
- 2729 items above graph maximum of 44
- 5707 items have value -10 (Less than one)
- 417 items have value -3 (Prefer not to answer)
- 5699 items have value -1 (Do not know)
|
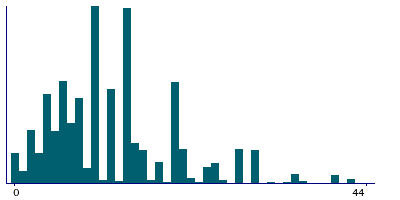
Instance 1 : First repeat assessment visit (2012-13)
20,314 participants, 20,314 items
| Maximum | 100 |
| Decile 9 | 22 |
| Decile 8 | 20 |
| Decile 7 | 14 |
| Decile 6 | 14 |
| Median | 10 |
| Decile 4 | 10 |
| Decile 3 | 7 |
| Decile 2 | 5 |
| Decile 1 | 3 |
| Minimum | 0 |
|
|
- There are 53 distinct values.
- Mean = 12.1811
- Std.dev = 8.2829
- 145 items above graph maximum of 41
- 261 items have value -10 (Less than one)
- 3 items have value -3 (Prefer not to answer)
- 116 items have value -1 (Do not know)
|
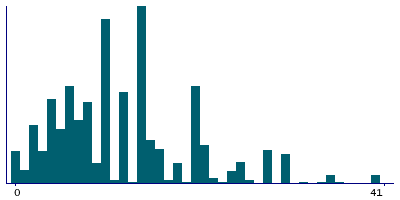
Instance 2 : Imaging visit (2014+)
100,917 participants, 100,917 items
| Maximum | 140 |
| Decile 9 | 20 |
| Decile 8 | 14 |
| Decile 7 | 12 |
| Decile 6 | 10 |
| Median | 8 |
| Decile 4 | 7 |
| Decile 3 | 6 |
| Decile 2 | 4 |
| Decile 1 | 2 |
| Minimum | 0 |
|
|
- There are 61 distinct values.
- Mean = 9.92699
- Std.dev = 6.92434
- 466 items above graph maximum of 38
- 1880 items have value -10 (Less than one)
- 29 items have value -3 (Prefer not to answer)
- 488 items have value -1 (Do not know)
|
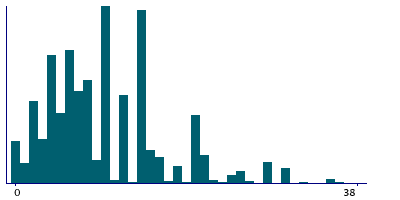
Instance 3 : First repeat imaging visit (2019+)
20,920 participants, 20,920 items
| Maximum | 60 |
| Decile 9 | 20 |
| Decile 8 | 14 |
| Decile 7 | 12 |
| Decile 6 | 10 |
| Median | 8 |
| Decile 4 | 7 |
| Decile 3 | 6 |
| Decile 2 | 4 |
| Decile 1 | 2 |
| Minimum | 0 |
|
|
- There are 43 distinct values.
- Mean = 9.68099
- Std.dev = 6.64782
- 87 items above graph maximum of 38
- 396 items have value -10 (Less than one)
- 2 items have value -3 (Prefer not to answer)
- 84 items have value -1 (Do not know)
|
Notes
ACE touchscreen question "How many slices of bread do you eat each WEEK?"
The following checks were performed:
- If answer < 0 then rejected
- If answer > 250 then rejected
- If answer > 50 then participant asked to confirm
If the participant activated the Help button they were shown the message:
For other types of bread:
- one bread roll = 2 slices
- one pitta bread = 2 slices
|
Coding 100373 defines 3 special values:
- -10 represents "Less than one"
- -1 represents "Do not know"
- -3 represents "Prefer not to answer"


