Data
572,501 items of data are available, covering 492,516 participants.
Defined-instances run from 0 to 3, labelled using Instancing
2.
Units of measurement are percent.
| Maximum | 74.9 |
| Decile 9 | 43.7 |
| Decile 8 | 38.5 |
| Decile 7 | 34.6 |
| Decile 6 | 30.9 |
| Median | 27.5 |
| Decile 4 | 24.7 |
| Decile 3 | 22.3 |
| Decile 2 | 20.2 |
| Decile 1 | 17.8 |
| Minimum | 1.1 |
|

|
- Mean = 29.3591
- Std.dev = 10.0958
- 46 items above graph maximum of 69.6
|
4 Instances
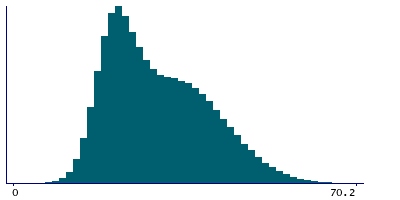
Instance 0 : Initial assessment visit (2006-2010) at which participants were recruited and consent given
491,707 participants, 491,707 items
| Maximum | 74.9 |
| Decile 9 | 44 |
| Decile 8 | 38.8 |
| Decile 7 | 34.8 |
| Decile 6 | 31.2 |
| Median | 27.7 |
| Decile 4 | 24.8 |
| Decile 3 | 22.4 |
| Decile 2 | 20.3 |
| Decile 1 | 17.8 |
| Minimum | 1.1 |
|
|
- Mean = 29.5313
- Std.dev = 10.1736
- 34 items above graph maximum of 70.2
|
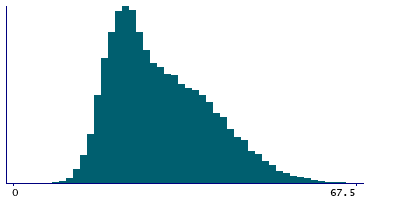
Instance 1 : First repeat assessment visit (2012-13)
20,022 participants, 20,022 items
| Maximum | 67.8 |
| Decile 9 | 42.8 |
| Decile 8 | 37.7 |
| Decile 7 | 33.8 |
| Decile 6 | 30.4 |
| Median | 27.3 |
| Decile 4 | 24.6 |
| Decile 3 | 22.5 |
| Decile 2 | 20.5 |
| Decile 1 | 18.1 |
| Minimum | 3.2 |
|
|
- Mean = 29.088
- Std.dev = 9.66277
- 1 item above graph maximum of 67.5
|
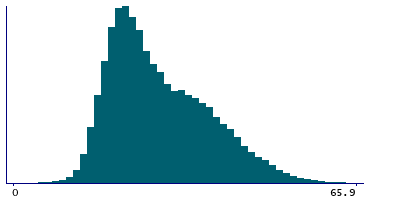
Instance 2 : Imaging visit (2014+)
55,607 participants, 55,607 items
| Maximum | 73.6 |
| Decile 9 | 41.7 |
| Decile 8 | 36.6 |
| Decile 7 | 32.6 |
| Decile 6 | 29 |
| Median | 26.1 |
| Decile 4 | 23.7 |
| Decile 3 | 21.7 |
| Decile 2 | 19.7 |
| Decile 1 | 17.5 |
| Minimum | 1.8 |
|
|
- Mean = 28.0845
- Std.dev = 9.49608
- 11 items above graph maximum of 65.9
|
Instance 3 : First repeat imaging visit (2019+)
5,165 participants, 5,165 items
| Maximum | 67.4 |
| Decile 9 | 41.2 |
| Decile 8 | 36 |
| Decile 7 | 32.1 |
| Decile 6 | 28.7 |
| Median | 25.8 |
| Decile 4 | 23.4 |
| Decile 3 | 21.4 |
| Decile 2 | 19.5 |
| Decile 1 | 17.2 |
| Minimum | 2 |
|

|
- Mean = 27.7379
- Std.dev = 9.38758
- 2 items above graph maximum of 65.2
|
Notes
Body composition estimation by impedance measurement. Right arm fat percentage
Range 1-75% in 0.1% increments.


