Data
82,772 items of data are available, covering 82,772 participants.
Defined-instances run from 0 to 1, labelled using Instancing
2.
Units of measurement are micrometres.
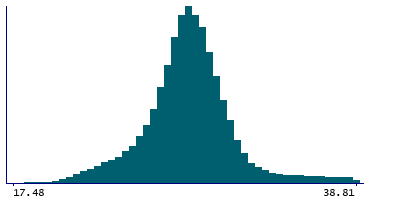
| Maximum | 76.93 |
| Decile 9 | 31.7 |
| Decile 8 | 30.25 |
| Decile 7 | 29.48 |
| Decile 6 | 28.9 |
| Median | 28.37 |
| Decile 4 | 27.85 |
| Decile 3 | 27.23 |
| Decile 2 | 26.34 |
| Decile 1 | 24.59 |
| Minimum | 0 |
|
|
- Mean = 28.1554
- Std.dev = 5.16262
- 1807 items below graph minimum of 17.48
- 1864 items above graph maximum of 38.81
|
2 Instances
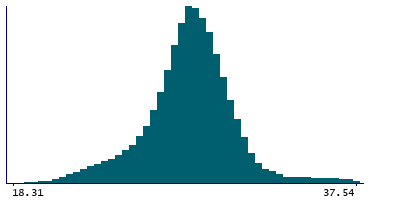
Instance 0 : Initial assessment visit (2006-2010) at which participants were recruited and consent given
67,222 participants, 67,222 items
| Maximum | 76.93 |
| Decile 9 | 31.13 |
| Decile 8 | 30.02 |
| Decile 7 | 29.35 |
| Decile 6 | 28.8 |
| Median | 28.3 |
| Decile 4 | 27.8 |
| Decile 3 | 27.21 |
| Decile 2 | 26.37 |
| Decile 1 | 24.72 |
| Minimum | 0 |
|
|
- Mean = 28.0851
- Std.dev = 4.53135
- 1017 items below graph minimum of 18.31
- 1516 items above graph maximum of 37.54
|
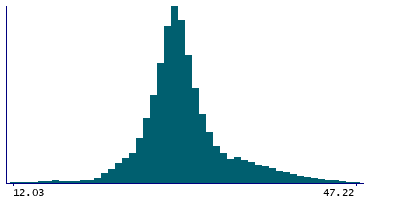
Instance 1 : First repeat assessment visit (2012-13)
15,550 participants, 15,550 items
| Maximum | 74.76 |
| Decile 9 | 35.49 |
| Decile 8 | 31.88 |
| Decile 7 | 30.39 |
| Decile 6 | 29.48 |
| Median | 28.78 |
| Decile 4 | 28.13 |
| Decile 3 | 27.35 |
| Decile 2 | 26.23 |
| Decile 1 | 23.76 |
| Minimum | 0 |
|
|
- Mean = 28.4592
- Std.dev = 7.27963
- 681 items below graph minimum of 12.03
- 81 items above graph maximum of 47.22
|
Notes
Average thickness measured between the external limiting membrane (ELM) to the inner and outer photoreceptor segments (ISOS) of the central subfield in the right eye. The publication detailing the methods can be found in
Publication 1876. Image source for measurements can be found in
Category 100016. Please be aware that these are the raw values generated by the Topcon Advanced Boundary Segmentation [TABS] software and should be quality controlled using the fields in
Category 100116. Please note that these fields have been derived separately from those in
Category 1081. Those wishing to utilise fields across both categories should proceed with additional caution.
0 Related Data-Fields
There are no related data-fields
0 Resources
There are no matching Resources
