Data
78,625 items of data are available, covering 74,332 participants.
Defined-instances run from 2 to 3, labelled using Instancing
2.
Units of measurement are ms.
| Maximum | 56.5457 |
| Decile 9 | 42.7464 |
| Decile 8 | 40.8769 |
| Decile 7 | 39.5002 |
| Decile 6 | 38.3051 |
| Median | 37.1558 |
| Decile 4 | 35.9732 |
| Decile 3 | 34.6421 |
| Decile 2 | 33.0058 |
| Decile 1 | 30.6535 |
| Minimum | 0 |
|
|
- Mean = 36.8781
- Std.dev = 4.7915
- 39 items below graph minimum of 18.5605
- 2 items above graph maximum of 54.8394
|
2 Instances
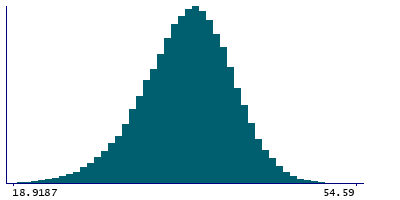
Instance 2 : Imaging visit (2014+)
73,987 participants, 73,987 items
| Maximum | 56.5457 |
| Decile 9 | 42.7625 |
| Decile 8 | 40.8814 |
| Decile 7 | 39.5033 |
| Decile 6 | 38.3061 |
| Median | 37.1537 |
| Decile 4 | 35.965 |
| Decile 3 | 34.63 |
| Decile 2 | 32.9823 |
| Decile 1 | 30.6389 |
| Minimum | 0 |
|

|
- Mean = 36.8743
- Std.dev = 4.80486
- 34 items below graph minimum of 18.5152
- 1 item above graph maximum of 54.8862
|
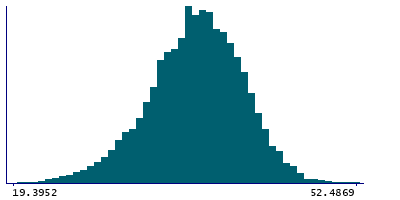
Instance 3 : First repeat imaging visit (2019+)
4,638 participants, 4,638 items
| Maximum | 52.4869 |
| Decile 9 | 42.4696 |
| Decile 8 | 40.7752 |
| Decile 7 | 39.4523 |
| Decile 6 | 38.278 |
| Median | 37.1854 |
| Decile 4 | 36.1162 |
| Decile 3 | 34.7919 |
| Decile 2 | 33.3378 |
| Decile 1 | 30.9312 |
| Minimum | 15.9133 |
|
|
- Mean = 36.9385
- Std.dev = 4.57265
- 3 items below graph minimum of 19.3928
|
Notes
Median T2star in left putamen (from SWI data)
0 Related Data-Fields
There are no related data-fields
2 Applications
| Application ID | Title |
|---|
| 17689 | Genetic, environmental and lifestyle predictors of brain/cognitive-related outcomes. |
| 22783 | The joint analysis of imaging data and genetic data for early tumor detection, prevention, diagnosis and treatment |


