Data
78,625 items of data are available, covering 74,332 participants.
Defined-instances run from 2 to 3, labelled using Instancing
2.
Units of measurement are ms.
| Maximum | 61.3402 |
| Decile 9 | 50.5256 |
| Decile 8 | 48.8335 |
| Decile 7 | 47.5594 |
| Decile 6 | 46.4293 |
| Median | 45.3042 |
| Decile 4 | 44.1272 |
| Decile 3 | 42.7741 |
| Decile 2 | 41.1209 |
| Decile 1 | 38.595 |
| Minimum | 0 |
|

|
- Mean = 44.8143
- Std.dev = 4.86517
- 252 items below graph minimum of 26.6643
|
2 Instances
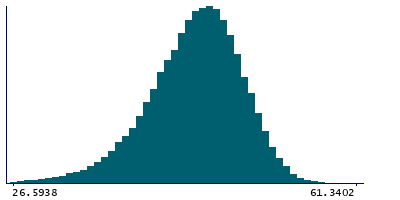
Instance 2 : Imaging visit (2014+)
73,987 participants, 73,987 items
| Maximum | 61.3402 |
| Decile 9 | 50.5318 |
| Decile 8 | 48.8233 |
| Decile 7 | 47.5501 |
| Decile 6 | 46.4221 |
| Median | 45.2859 |
| Decile 4 | 44.1117 |
| Decile 3 | 42.7619 |
| Decile 2 | 41.1015 |
| Decile 1 | 38.5652 |
| Minimum | 0 |
|
|
- Mean = 44.8047
- Std.dev = 4.87101
- 232 items below graph minimum of 26.5987
|
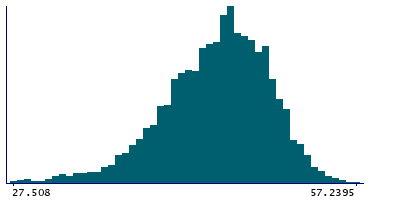
Instance 3 : First repeat imaging visit (2019+)
4,638 participants, 4,638 items
| Maximum | 57.2395 |
| Decile 9 | 50.4206 |
| Decile 8 | 48.9795 |
| Decile 7 | 47.7123 |
| Decile 6 | 46.5447 |
| Median | 45.5722 |
| Decile 4 | 44.3442 |
| Decile 3 | 42.956 |
| Decile 2 | 41.407 |
| Decile 1 | 38.9622 |
| Minimum | 12.7948 |
|
|
- Mean = 44.9673
- Std.dev = 4.76842
- 19 items below graph minimum of 27.5038
|
Notes
Median T2star in left amygdala (from SWI data)
0 Related Data-Fields
There are no related data-fields
2 Applications
| Application ID | Title |
|---|
| 17689 | Genetic, environmental and lifestyle predictors of brain/cognitive-related outcomes. |
| 22783 | The joint analysis of imaging data and genetic data for early tumor detection, prevention, diagnosis and treatment |


