Data
83,911 items of data are available, covering 79,384 participants.
Defined-instances run from 2 to 3, labelled using Instancing
2.
Units of measurement are AU.
| Maximum | 0.924251 |
| Decile 9 | 0.836703 |
| Decile 8 | 0.81767 |
| Decile 7 | 0.801837 |
| Decile 6 | 0.786764 |
| Median | 0.770663 |
| Decile 4 | 0.752778 |
| Decile 3 | 0.731388 |
| Decile 2 | 0.703909 |
| Decile 1 | 0.659909 |
| Minimum | -0.225693 |
|
|
- Mean = 0.756921
- Std.dev = 0.0740305
- 409 items below graph minimum of 0.483114
|
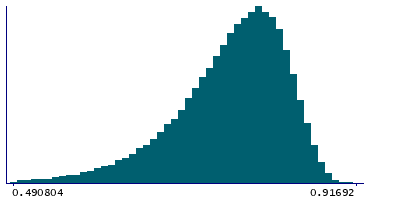
2 Instances
Instance 2 : Imaging visit (2014+)
79,153 participants, 79,153 items
| Maximum | 0.924251 |
| Decile 9 | 0.836746 |
| Decile 8 | 0.817645 |
| Decile 7 | 0.801757 |
| Decile 6 | 0.786645 |
| Median | 0.770431 |
| Decile 4 | 0.752474 |
| Decile 3 | 0.731089 |
| Decile 2 | 0.703477 |
| Decile 1 | 0.659031 |
| Minimum | -0.225693 |
|

|
- Mean = 0.756676
- Std.dev = 0.0742803
- 372 items below graph minimum of 0.481317
|
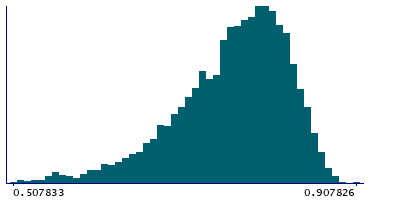
Instance 3 : First repeat imaging visit (2019+)
4,758 participants, 4,758 items
| Maximum | 0.907826 |
| Decile 9 | 0.835783 |
| Decile 8 | 0.818237 |
| Decile 7 | 0.803354 |
| Decile 6 | 0.788652 |
| Median | 0.773382 |
| Decile 4 | 0.757246 |
| Decile 3 | 0.735917 |
| Decile 2 | 0.710933 |
| Decile 1 | 0.671712 |
| Minimum | 0.065551 |
|
|
- Mean = 0.760986
- Std.dev = 0.0696187
- 29 items below graph minimum of 0.50764
|
Notes
Mean MO (diffusion tensor mode) in posterior thalamic radiation (right) on FA (fractional anisotropy) skeleton (from dMRI data)
0 Related Data-Fields
There are no related data-fields
2 Applications
| Application ID | Title |
|---|
| 17689 | Genetic, environmental and lifestyle predictors of brain/cognitive-related outcomes. |
| 22783 | The joint analysis of imaging data and genetic data for early tumor detection, prevention, diagnosis and treatment |

