Data
445,581 items of data are available, covering 351,226 participants.
Some values have special meanings defined by Data-Coding
100291.
Defined-instances run from 0 to 3, labelled using Instancing
2.
Units of measurement are measures.
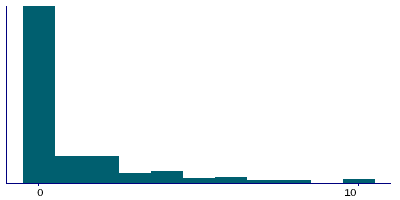
| Maximum | 250 |
| Decile 9 | 5 |
| Decile 8 | 2 |
| Decile 7 | 1 |
| Decile 6 | 0 |
| Median | 0 |
| Decile 4 | 0 |
| Decile 3 | 0 |
| Decile 2 | 0 |
| Decile 1 | 0 |
| Minimum | 0 |
|

|
- There are 84 distinct values.
- Mean = 1.81914
- Std.dev = 5.11808
- 14584 items above graph maximum of 10
- 524 items have value -3 (Prefer not to answer)
- 2564 items have value -1 (Do not know)
|
4 Instances
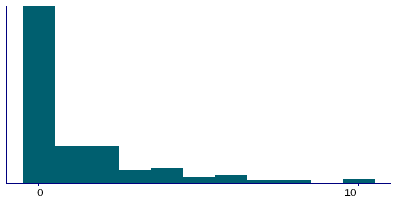
Instance 0 : Initial assessment visit (2006-2010) at which participants were recruited and consent given
346,120 participants, 346,120 items
| Maximum | 250 |
| Decile 9 | 5 |
| Decile 8 | 2 |
| Decile 7 | 1 |
| Decile 6 | 0 |
| Median | 0 |
| Decile 4 | 0 |
| Decile 3 | 0 |
| Decile 2 | 0 |
| Decile 1 | 0 |
| Minimum | 0 |
|
|
- There are 82 distinct values.
- Mean = 1.85493
- Std.dev = 5.34338
- 12048 items above graph maximum of 10
- 460 items have value -3 (Prefer not to answer)
- 2276 items have value -1 (Do not know)
|
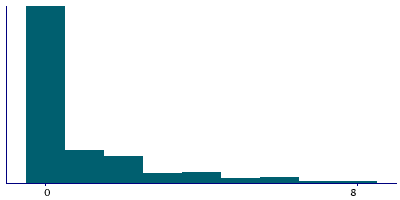
Instance 1 : First repeat assessment visit (2012-13)
14,494 participants, 14,494 items
| Maximum | 105 |
| Decile 9 | 4 |
| Decile 8 | 2 |
| Decile 7 | 1 |
| Decile 6 | 0 |
| Median | 0 |
| Decile 4 | 0 |
| Decile 3 | 0 |
| Decile 2 | 0 |
| Decile 1 | 0 |
| Minimum | 0 |
|
|
- There are 35 distinct values.
- Mean = 1.46407
- Std.dev = 3.91766
- 486 items above graph maximum of 8
- 6 items have value -3 (Prefer not to answer)
- 29 items have value -1 (Do not know)
|
Instance 2 : Imaging visit (2014+)
70,511 participants, 70,511 items
| Maximum | 175 |
| Decile 9 | 4 |
| Decile 8 | 2 |
| Decile 7 | 2 |
| Decile 6 | 1 |
| Median | 0 |
| Decile 4 | 0 |
| Decile 3 | 0 |
| Decile 2 | 0 |
| Decile 1 | 0 |
| Minimum | 0 |
|
|
- There are 48 distinct values.
- Mean = 1.71095
- Std.dev = 4.2517
- 2687 items above graph maximum of 8
- 51 items have value -3 (Prefer not to answer)
- 220 items have value -1 (Do not know)
|
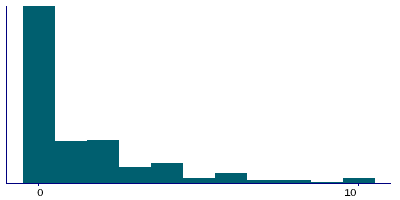
Instance 3 : First repeat imaging visit (2019+)
14,456 participants, 14,456 items
| Maximum | 200 |
| Decile 9 | 5 |
| Decile 8 | 3 |
| Decile 7 | 2 |
| Decile 6 | 1 |
| Median | 0 |
| Decile 4 | 0 |
| Decile 3 | 0 |
| Decile 2 | 0 |
| Decile 1 | 0 |
| Minimum | 0 |
|
|
- There are 38 distinct values.
- Mean = 1.85003
- Std.dev = 4.50188
- 399 items above graph maximum of 10
- 7 items have value -3 (Prefer not to answer)
- 39 items have value -1 (Do not know)
|
Notes
ACE touchscreen question "In an average WEEK, how many measures of spirits or liqueurs would you drink? (there are 25 standard measures in a normal sized bottle; spirits include drinks such as whisky, gin, rum, vodka, brandy)"
The following checks were performed:
- If answer < 0 then rejected
- If answer > 250 then rejected
- If answer > 100 then participant asked to confirm
If the participant activated the Help button they were shown the message:
For mixed drinks that contain spirits or liqueurs, count one bottle
as one measure. There is a question later on alcopops
|
Field 1598 was collected from participants who indicated they drink alcohol more often than once or twice a week, as defined by their answers to Field 1558
Coding 100291 defines 2 special values:
- -1 represents "Do not know"
- -3 represents "Prefer not to answer"
1 Related Data-Field
| Field ID | Description | Relationship |
|---|
| 1558 | Alcohol intake frequency. | Current Field was collected from participants who indicated they drink alcohol more often than once or twice a week, as defined by their answers to Field 1558 |
1 Application
| Application ID | Title |
|---|
| 31187 | Integrative Prioritization of Loci for Alcohol Use Disorders and Associated Complex Traits |


