Data
571,699 items of data are available, covering 491,837 participants.
Defined-instances run from 0 to 3, labelled using Instancing
2.
Units of measurement are Kg.
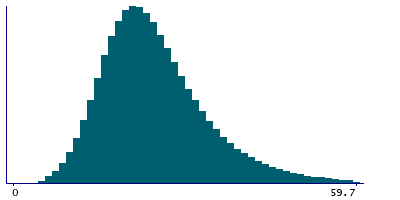
| Maximum | 109.8 |
| Decile 9 | 37 |
| Decile 8 | 31.4 |
| Decile 7 | 28 |
| Decile 6 | 25.4 |
| Median | 23.3 |
| Decile 4 | 21.3 |
| Decile 3 | 19.3 |
| Decile 2 | 17.1 |
| Decile 1 | 14.3 |
| Minimum | 5 |
|
|
- Mean = 24.7637
- Std.dev = 9.49468
- 2938 items above graph maximum of 59.7
|
4 Instances
Instance 0 : Initial assessment visit (2006-2010) at which participants were recruited and consent given
490,976 participants, 490,976 items
| Maximum | 109.8 |
| Decile 9 | 37.2 |
| Decile 8 | 31.6 |
| Decile 7 | 28.1 |
| Decile 6 | 25.5 |
| Median | 23.3 |
| Decile 4 | 21.3 |
| Decile 3 | 19.3 |
| Decile 2 | 17.2 |
| Decile 1 | 14.4 |
| Minimum | 5 |
|

|
- Mean = 24.8577
- Std.dev = 9.56563
- 2492 items above graph maximum of 60
|
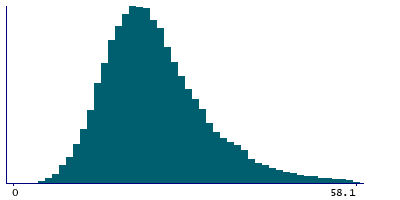
Instance 1 : First repeat assessment visit (2012-13)
20,001 participants, 20,001 items
| Maximum | 88.1 |
| Decile 9 | 36.2 |
| Decile 8 | 30.7 |
| Decile 7 | 27.4 |
| Decile 6 | 24.9 |
| Median | 22.9 |
| Decile 4 | 21 |
| Decile 3 | 19.1 |
| Decile 2 | 17 |
| Decile 1 | 14.3 |
| Minimum | 5 |
|
|
- Mean = 24.3156
- Std.dev = 9.15107
- 113 items above graph maximum of 58.1
|
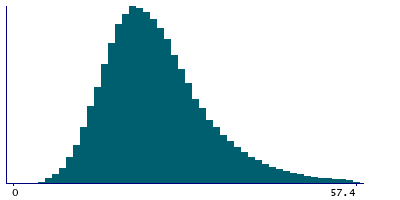
Instance 2 : Imaging visit (2014+)
55,559 participants, 55,559 items
| Maximum | 99.7 |
| Decile 9 | 35.8 |
| Decile 8 | 30.5 |
| Decile 7 | 27.3 |
| Decile 6 | 24.9 |
| Median | 22.8 |
| Decile 4 | 20.9 |
| Decile 3 | 19 |
| Decile 2 | 16.9 |
| Decile 1 | 14.2 |
| Minimum | 5 |
|
|
- Mean = 24.1651
- Std.dev = 9.00615
- 293 items above graph maximum of 57.4
|
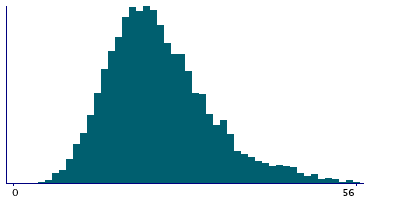
Instance 3 : First repeat imaging visit (2019+)
5,163 participants, 5,163 items
| Maximum | 95.7 |
| Decile 9 | 35.1 |
| Decile 8 | 30.35 |
| Decile 7 | 27.3 |
| Decile 6 | 24.8 |
| Median | 22.7 |
| Decile 4 | 20.8 |
| Decile 3 | 18.9 |
| Decile 2 | 16.9 |
| Decile 1 | 14.2 |
| Minimum | 5.1 |
|
|
- Mean = 24.0079
- Std.dev = 8.80771
- 24 items above graph maximum of 56
|
Notes
Body composition estimation by impedance measurement. Fat mass
Total fat mass in Kg, in 0.1Kg increments.


