Data
282,170 items of data are available, covering 220,489 participants.
Some values have special meanings defined by Data-Coding
100595.
Defined-instances run from 0 to 3, labelled using Instancing
2.
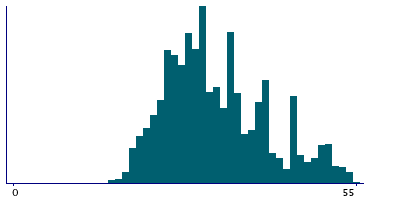
Units of measurement are years.
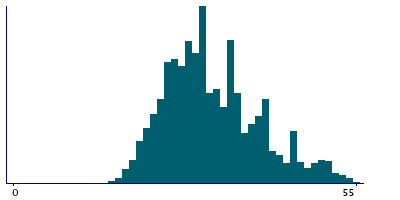
| Maximum | 55 |
| Decile 9 | 43 |
| Decile 8 | 39 |
| Decile 7 | 35 |
| Decile 6 | 33 |
| Median | 30 |
| Decile 4 | 29 |
| Decile 3 | 27 |
| Decile 2 | 25 |
| Decile 1 | 23 |
| Minimum | 5 |
|
|
- There are 48 distinct values.
- Mean = 32.0436
- Std.dev = 7.70942
- 806 items above graph maximum of 55
- 5166 items have value -11 (Still taking the pill)
- 528 items have value -3 (Prefer not to answer)
- 29860 items have value -1 (Do not know)
|
4 Instances
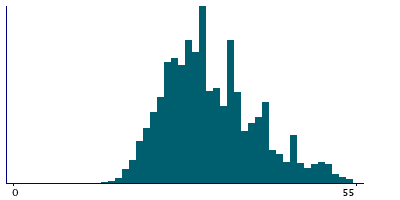
Instance 0 : Initial assessment visit (2006-2010) at which participants were recruited and consent given
219,802 participants, 219,802 items
| Maximum | 55 |
| Decile 9 | 42 |
| Decile 8 | 38 |
| Decile 7 | 35 |
| Decile 6 | 33 |
| Median | 30 |
| Decile 4 | 29 |
| Decile 3 | 27 |
| Decile 2 | 25 |
| Decile 1 | 23 |
| Minimum | 5 |
|
|
- There are 48 distinct values.
- Mean = 31.8243
- Std.dev = 7.51675
- 407 items above graph maximum of 55
- 4910 items have value -11 (Still taking the pill)
- 449 items have value -3 (Prefer not to answer)
- 21999 items have value -1 (Do not know)
|
Instance 1 : First repeat assessment visit (2012-13)
8,435 participants, 8,435 items
| Maximum | 55 |
| Decile 9 | 44 |
| Decile 8 | 39 |
| Decile 7 | 35 |
| Decile 6 | 33 |
| Median | 30 |
| Decile 4 | 29 |
| Decile 3 | 27 |
| Decile 2 | 25 |
| Decile 1 | 23 |
| Minimum | 10 |
|
|
- There are 41 distinct values.
- Mean = 32.189
- Std.dev = 7.74177
- 27 items above graph maximum of 55
- 111 items have value -11 (Still taking the pill)
- 8 items have value -3 (Prefer not to answer)
- 893 items have value -1 (Do not know)
|
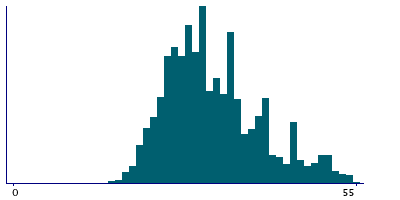
Instance 2 : Imaging visit (2014+)
44,773 participants, 44,773 items
| Maximum | 55 |
| Decile 9 | 45 |
| Decile 8 | 40 |
| Decile 7 | 36 |
| Decile 6 | 34 |
| Median | 31 |
| Decile 4 | 30 |
| Decile 3 | 28 |
| Decile 2 | 26 |
| Decile 1 | 23 |
| Minimum | 13 |
|
|
- There are 43 distinct values.
- Mean = 32.9187
- Std.dev = 8.3883
- 310 items above graph maximum of 55
- 138 items have value -11 (Still taking the pill)
- 58 items have value -3 (Prefer not to answer)
- 5695 items have value -1 (Do not know)
|
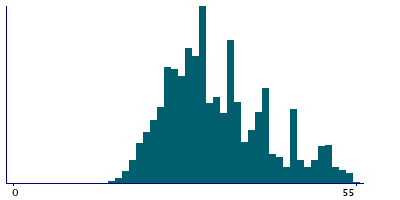
Instance 3 : First repeat imaging visit (2019+)
9,160 participants, 9,160 items
| Maximum | 55 |
| Decile 9 | 45 |
| Decile 8 | 40 |
| Decile 7 | 36 |
| Decile 6 | 34 |
| Median | 31 |
| Decile 4 | 30 |
| Decile 3 | 28 |
| Decile 2 | 25 |
| Decile 1 | 23 |
| Minimum | 14 |
|
|
- There are 42 distinct values.
- Mean = 32.9476
- Std.dev = 8.4213
- 62 items above graph maximum of 55
- 7 items have value -11 (Still taking the pill)
- 13 items have value -3 (Prefer not to answer)
- 1273 items have value -1 (Do not know)
|
Notes
ACE touchscreen question "How old were you when you last used the contraceptive pill?"
The following checks were performed:
- If answer < 5 then rejected
- If answer > Participants age then rejected
- If answer < 10 then participant asked to confirm
- If answer > 60 then participant asked to confirm
If the participant activated the Help button they were shown the message:
If you are currently taking the pill select Still taking the pill.
If you are unsure, please provide an estimate or select Do not know.
|
Field 2804 was collected from women who indicated that they had taken the contraceptive pill, as defined by their answers to Field 2784
Coding 100595 defines 3 special values:
- -1 represents "Do not know"
- -3 represents "Prefer not to answer"
- -11 represents "Still taking the pill"
1 Related Data-Field
| Field ID | Description | Relationship |
|---|
| 2784 | Ever taken oral contraceptive pill | Current Field was collected from women who indicated that they had taken the contraceptive pill, as defined by their answers to Field 2784 |
4 Applications
| Application ID | Title |
|---|
| 26629 | Cross-cultural variations in female reproductive health and non-communicable diseases: analysis of 500,000 participants from the UKBiobank and the InterLACE consortium |
| 5791 | Development and validation of risk prediction model for breast and ovarian cancers |
| 17435 | Exploring the genetics of irritable bowel syndrome: the ?bellygenes? initiative (project approved by bbmri-lpc) |
| 871 | Genetic factors associated with being at different extremes of the reproductive lifespan |


