Data
152,458 items of data are available, covering 125,074 participants.
Some values have special meanings defined by Data-Coding
100291.
Defined-instances run from 0 to 3, labelled using Instancing
2.
| Maximum | 200 |
| Decile 9 | 6 |
| Decile 8 | 4 |
| Decile 7 | 3 |
| Decile 6 | 2 |
| Median | 2 |
| Decile 4 | 1 |
| Decile 3 | 1 |
| Decile 2 | 0 |
| Decile 1 | 0 |
| Minimum | 0 |
|

|
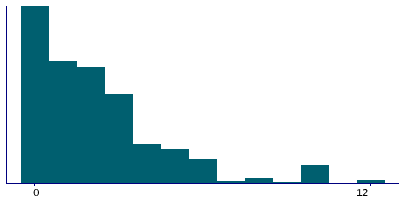
- There are 65 distinct values.
- Mean = 2.9507
- Std.dev = 7.34342
- 3312 items above graph maximum of 12
- 390 items have value -3 (Prefer not to answer)
- 13439 items have value -1 (Do not know)
|
4 Instances
Instance 0 : Initial assessment visit (2006-2010) at which participants were recruited and consent given
119,899 participants, 119,899 items
| Maximum | 200 |
| Decile 9 | 6 |
| Decile 8 | 4 |
| Decile 7 | 3 |
| Decile 6 | 2 |
| Median | 2 |
| Decile 4 | 1 |
| Decile 3 | 1 |
| Decile 2 | 0 |
| Decile 1 | 0 |
| Minimum | 0 |
|
|
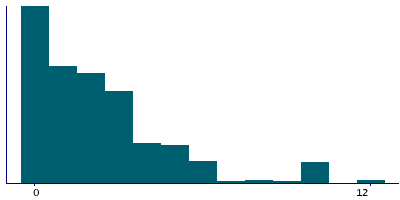
- There are 61 distinct values.
- Mean = 2.95953
- Std.dev = 7.50538
- 2578 items above graph maximum of 12
- 340 items have value -3 (Prefer not to answer)
- 10701 items have value -1 (Do not know)
|
Instance 1 : First repeat assessment visit (2012-13)
5,063 participants, 5,063 items
| Maximum | 100 |
| Decile 9 | 6 |
| Decile 8 | 4 |
| Decile 7 | 3 |
| Decile 6 | 2 |
| Median | 2 |
| Decile 4 | 1 |
| Decile 3 | 1 |
| Decile 2 | 0 |
| Decile 1 | 0 |
| Minimum | 0 |
|
|
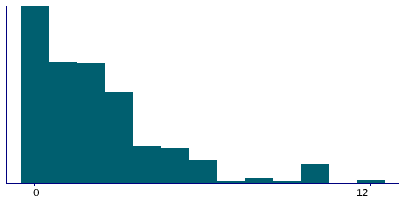
- There are 26 distinct values.
- Mean = 2.87295
- Std.dev = 5.90225
- 116 items above graph maximum of 12
- 9 items have value -3 (Prefer not to answer)
- 410 items have value -1 (Do not know)
|
Instance 2 : Imaging visit (2014+)
22,926 participants, 22,926 items
| Maximum | 200 |
| Decile 9 | 6 |
| Decile 8 | 4 |
| Decile 7 | 3 |
| Decile 6 | 2 |
| Median | 2 |
| Decile 4 | 1 |
| Decile 3 | 1 |
| Decile 2 | 0 |
| Decile 1 | 0 |
| Minimum | 0 |
|
|
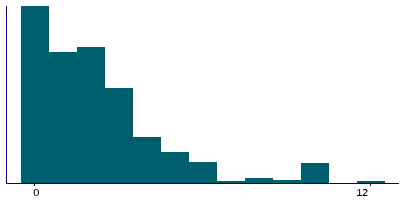
- There are 42 distinct values.
- Mean = 2.95494
- Std.dev = 6.97513
- 518 items above graph maximum of 12
- 36 items have value -3 (Prefer not to answer)
- 1920 items have value -1 (Do not know)
|
Instance 3 : First repeat imaging visit (2019+)
4,570 participants, 4,570 items
| Maximum | 200 |
| Decile 9 | 5 |
| Decile 8 | 4 |
| Decile 7 | 3 |
| Decile 6 | 2 |
| Median | 2 |
| Decile 4 | 1 |
| Decile 3 | 1 |
| Decile 2 | 0 |
| Decile 1 | 0 |
| Minimum | 0 |
|
|
- There are 23 distinct values.
- Mean = 2.78494
- Std.dev = 6.23194
- 119 items above graph maximum of 10
- 5 items have value -3 (Prefer not to answer)
- 408 items have value -1 (Do not know)
|
Notes
ACE touchscreen question "How many times did you try to give up smoking before you were successful?"
The following checks were performed:
- If answer < 0 then rejected
- If answer > 200 then rejected
- If answer > 20 then participant asked to confirm
If the participant activated the Help button they were shown the message:
If you are unsure, please provide an estimate or select Do not know.
|
Field 2926 was collected from participants who indicated that in the past they smoked tobacco on most or all days, as defined by their answers to Field 1249 and that during the time they smoked they stopped for more than 6 months, as defined by their answers to Field 1249
Coding 100291 defines 2 special values:
- -1 represents "Do not know"
- -3 represents "Prefer not to answer"
2 Related Data-Fields
| Field ID | Description | Relationship |
|---|
| 2907 | Ever stopped smoking for 6+ months | Field 2907 affects who was asked to answer Current Field |
| 1249 | Past tobacco smoking | Field 1249 affects who was asked to answer Current Field |
1 Application
| Application ID | Title |
|---|
| 2482 | Comparisson of smoking behaviour between men and women to assess risk inducing habits |


