Data
66,611 items of data are available, covering 64,144 participants.
Some values have special meanings defined by Data-Coding
100582.
Defined-instances run from 0 to 3, labelled using Instancing
2.
Units of measurement are days.
| Maximum | 365 |
| Decile 9 | 30 |
| Decile 8 | 28 |
| Decile 7 | 28 |
| Decile 6 | 28 |
| Median | 28 |
| Decile 4 | 28 |
| Decile 3 | 26 |
| Decile 2 | 24 |
| Decile 1 | 21 |
| Minimum | 7 |
|
|
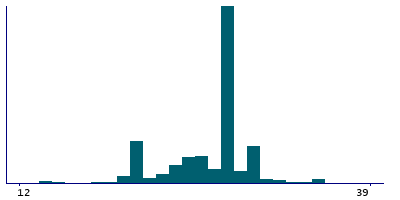
- There are 76 distinct values.
- Mean = 26.8218
- Std.dev = 7.35062
- 356 items below graph minimum of 12
- 468 items above graph maximum of 39
- 11609 items have value -6 (Irregular cycle)
- 819 items have value -3 (Prefer not to answer)
- 4295 items have value -1 (Do not know)
|
4 Instances
Instance 0 : Initial assessment visit (2006-2010) at which participants were recruited and consent given
63,936 participants, 63,936 items
| Maximum | 365 |
| Decile 9 | 30 |
| Decile 8 | 28 |
| Decile 7 | 28 |
| Decile 6 | 28 |
| Median | 28 |
| Decile 4 | 28 |
| Decile 3 | 26 |
| Decile 2 | 24 |
| Decile 1 | 21 |
| Minimum | 7 |
|

|
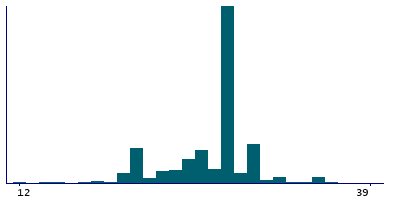
- There are 76 distinct values.
- Mean = 26.7849
- Std.dev = 7.15387
- 347 items below graph minimum of 12
- 433 items above graph maximum of 39
- 10863 items have value -6 (Irregular cycle)
- 752 items have value -3 (Prefer not to answer)
- 4056 items have value -1 (Do not know)
|
Instance 1 : First repeat assessment visit (2012-13)
1,045 participants, 1,045 items
| Maximum | 120 |
| Decile 9 | 30 |
| Decile 8 | 28 |
| Decile 7 | 28 |
| Decile 6 | 28 |
| Median | 28 |
| Decile 4 | 28 |
| Decile 3 | 26 |
| Decile 2 | 24 |
| Decile 1 | 21 |
| Minimum | 7 |
|
|
- There are 29 distinct values.
- Mean = 27.1122
- Std.dev = 6.67106
- 3 items below graph minimum of 12
- 7 items above graph maximum of 39
- 263 items have value -6 (Irregular cycle)
- 14 items have value -3 (Prefer not to answer)
- 64 items have value -1 (Do not know)
|
Instance 2 : Imaging visit (2014+)
1,525 participants, 1,525 items
| Maximum | 300 |
| Decile 9 | 30 |
| Decile 8 | 29 |
| Decile 7 | 28 |
| Decile 6 | 28 |
| Median | 28 |
| Decile 4 | 28 |
| Decile 3 | 26 |
| Decile 2 | 25 |
| Decile 1 | 21 |
| Minimum | 7 |
|
|
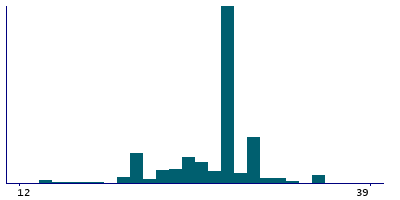
- There are 37 distinct values.
- Mean = 28.5
- Std.dev = 14.4984
- 5 items below graph minimum of 12
- 25 items above graph maximum of 39
- 455 items have value -6 (Irregular cycle)
- 46 items have value -3 (Prefer not to answer)
- 146 items have value -1 (Do not know)
|
Instance 3 : First repeat imaging visit (2019+)
105 participants, 105 items
| Maximum | 90 |
| Decile 9 | 30 |
| Decile 8 | 29 |
| Decile 7 | 28 |
| Decile 6 | 28 |
| Median | 28 |
| Decile 4 | 28 |
| Decile 3 | 26 |
| Decile 2 | 25.5 |
| Decile 1 | 20.5 |
| Minimum | 7 |
|
|
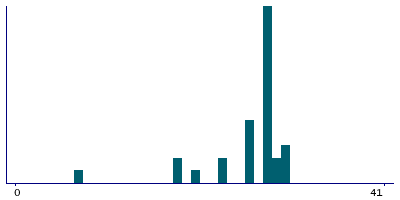
- There are 12 distinct values.
- Mean = 29.439
- Std.dev = 12.7472
- 1 item below graph minimum of 11
- 3 items above graph maximum of 39
- 28 items have value -6 (Irregular cycle)
- 7 items have value -3 (Prefer not to answer)
- 29 items have value -1 (Do not know)
|
Notes
ACE touchscreen question "How many days is your usual menstrual cycle? (The number of days between each menstrual period)"
The following checks were performed:
- If answer < 7 then rejected
- If answer > 365 then rejected
- If answer < 12 then participant asked to confirm
- If answer > 60 then participant asked to confirm
Field 3710 was collected from women who indicated that their periods had not stopped (menopause), as defined by their answers to Field 2724
Coding 100582 defines 3 special values:
- -6 represents "Irregular cycle"
- -1 represents "Do not know"
- -3 represents "Prefer not to answer"
1 Related Data-Field
| Field ID | Description | Relationship |
|---|
| 2724 | Had menopause | Current Field was collected from women who indicated that their periods had not stopped (menopause), as defined by their answers to Field 2724 |
3 Applications
| Application ID | Title |
|---|
| 26629 | Cross-cultural variations in female reproductive health and non-communicable diseases: analysis of 500,000 participants from the UKBiobank and the InterLACE consortium |
| 5791 | Development and validation of risk prediction model for breast and ovarian cancers |
| 871 | Genetic factors associated with being at different extremes of the reproductive lifespan |


