Data
1,155,326 items of data are available, covering 476,035 participants.
Defined-instances run from 0 to 3, labelled using Instancing
2.
Array indices run from 0 to 1.
Units of measurement are mmHg.
| Maximum | 148 |
| Decile 9 | 95 |
| Decile 8 | 90 |
| Decile 7 | 87 |
| Decile 6 | 84 |
| Median | 81 |
| Decile 4 | 79 |
| Decile 3 | 76 |
| Decile 2 | 73 |
| Decile 1 | 68 |
| Minimum | 30 |
|
|
- There are 115 distinct values.
- Mean = 81.6273
- Std.dev = 10.5641
- 40 items below graph minimum of 41
- 620 items above graph maximum of 122
|
4 Instances
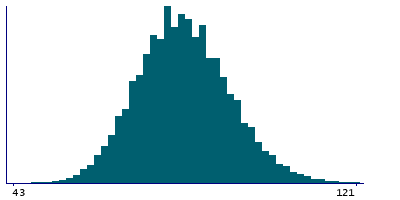
Instance 0 : Initial assessment visit (2006-2010) at which participants were recruited and consent given
471,854 participants, 928,304 items
| Maximum | 148 |
| Decile 9 | 96 |
| Decile 8 | 91 |
| Decile 7 | 87 |
| Decile 6 | 84 |
| Median | 82 |
| Decile 4 | 79 |
| Decile 3 | 76 |
| Decile 2 | 73 |
| Decile 1 | 69 |
| Minimum | 30 |
|

|
- There are 112 distinct values.
- Mean = 82.2082
- Std.dev = 10.4956
- 29 items below graph minimum of 42
- 456 items above graph maximum of 123
|
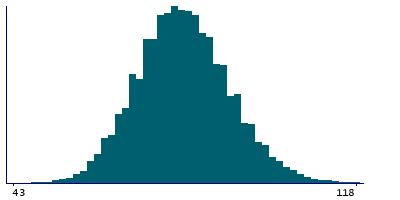
Instance 1 : First repeat assessment visit (2012-13)
20,267 participants, 40,353 items
| Maximum | 128 |
| Decile 9 | 93 |
| Decile 8 | 88 |
| Decile 7 | 85 |
| Decile 6 | 82 |
| Median | 80 |
| Decile 4 | 77 |
| Decile 3 | 75 |
| Decile 2 | 72 |
| Decile 1 | 68 |
| Minimum | 35 |
|
|
- There are 82 distinct values.
- Mean = 80.1569
- Std.dev = 10.0868
- 1 item below graph minimum of 43
- 14 items above graph maximum of 118
|
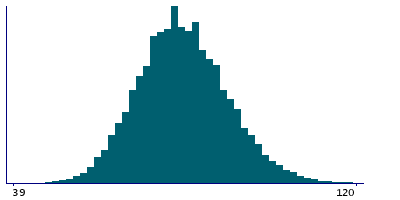
Instance 2 : Imaging visit (2014+)
82,728 participants, 160,239 items
| Maximum | 143 |
| Decile 9 | 93 |
| Decile 8 | 88 |
| Decile 7 | 84 |
| Decile 6 | 81 |
| Median | 79 |
| Decile 4 | 76 |
| Decile 3 | 73 |
| Decile 2 | 70 |
| Decile 1 | 66 |
| Minimum | 32 |
|
|
- There are 102 distinct values.
- Mean = 79.0248
- Std.dev = 10.6069
- 10 items below graph minimum of 39
- 78 items above graph maximum of 120
|
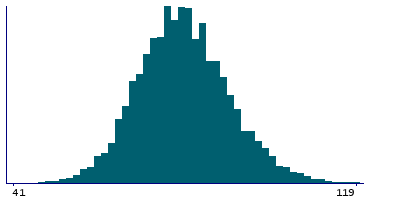
Instance 3 : First repeat imaging visit (2019+)
13,539 participants, 26,430 items
| Maximum | 138 |
| Decile 9 | 93 |
| Decile 8 | 88 |
| Decile 7 | 84 |
| Decile 6 | 81 |
| Median | 79 |
| Decile 4 | 76 |
| Decile 3 | 74 |
| Decile 2 | 70 |
| Decile 1 | 66 |
| Minimum | 35 |
|
|
- There are 90 distinct values.
- Mean = 79.2461
- Std.dev = 10.4847
- 1 item below graph minimum of 39
- 12 items above graph maximum of 120
|
Notes
Blood pressure, automated reading, diastolic. Two measures of blood pressure were taken a few moments apart.
Range returned by the Omron device is is 0-255


