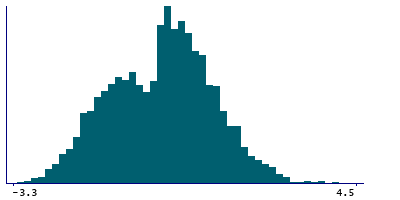
Data
6,010 items of data are available, covering 6,003 participants.
Defined-instances run from 0 to 3, labelled using Instancing
2.
Units of measurement are Std.Devs.
| Maximum | 6.2 |
| Decile 9 | 1.5 |
| Decile 8 | 1 |
| Decile 7 | 0.7 |
| Decile 6 | 0.4 |
| Median | 0.1 |
| Decile 4 | -0.2 |
| Decile 3 | -0.6 |
| Decile 2 | -1 |
| Decile 1 | -1.5 |
| Minimum | -3.3 |
|
|
- Mean = 0.071371
- Std.dev = 1.17632
- 9 items above graph maximum of 4.5
|
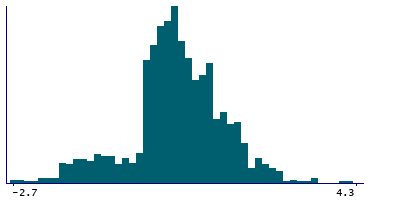
4 Instances
Instance 0 : Initial assessment visit (2006-2010) at which participants were recruited and consent given
1,228 participants, 1,228 items
| Maximum | 6.2 |
| Decile 9 | 1.8 |
| Decile 8 | 1.4 |
| Decile 7 | 1.1 |
| Decile 6 | 0.8 |
| Median | 0.6 |
| Decile 4 | 0.5 |
| Decile 3 | 0.3 |
| Decile 2 | 0.1 |
| Decile 1 | -0.7 |
| Minimum | -2.7 |
|
|
- Mean = 0.64298
- Std.dev = 1.00726
- 5 items above graph maximum of 4.3
|
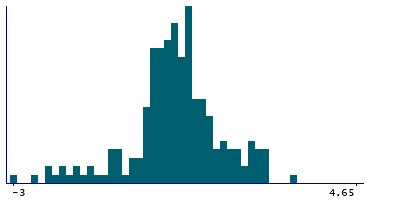
Instance 1 : First repeat assessment visit (2012-13)
205 participants, 205 items
| Maximum | 5.8 |
| Decile 9 | 2 |
| Decile 8 | 1.3 |
| Decile 7 | 1 |
| Decile 6 | 0.8 |
| Median | 0.6 |
| Decile 4 | 0.5 |
| Decile 3 | 0.3 |
| Decile 2 | 0.1 |
| Decile 1 | -0.65 |
| Minimum | -3 |
|
|
- Mean = 0.649268
- Std.dev = 1.0733
- 1 item above graph maximum of 4.65
|
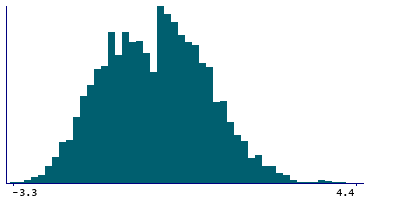
Instance 2 : Imaging visit (2014+)
4,567 participants, 4,567 items
| Maximum | 4.9 |
| Decile 9 | 1.4 |
| Decile 8 | 0.9 |
| Decile 7 | 0.5 |
| Decile 6 | 0.2 |
| Median | -0.1 |
| Decile 4 | -0.5 |
| Decile 3 | -0.8 |
| Decile 2 | -1.2 |
| Decile 1 | -1.6 |
| Minimum | -3.3 |
|
|
- Mean = -0.107432
- Std.dev = 1.16611
- 3 items above graph maximum of 4.4
|
Instance 3 : First repeat imaging visit (2019+)
10 participants, 10 items
Too few values for statistical summary.


