Data
286,819 items of data are available, covering 236,313 participants.
Defined-instances run from 0 to 3, labelled using Instancing
2.
| Maximum | 4952 |
| Decile 9 | 83 |
| Decile 8 | 79 |
| Decile 7 | 76 |
| Decile 6 | 73 |
| Median | 70 |
| Decile 4 | 66 |
| Decile 3 | 62 |
| Decile 2 | 56 |
| Decile 1 | 47 |
| Minimum | -4813 |
|
|
- There are 646 distinct values.
- Mean = 68.2866
- Std.dev = 38.8568
- 134 items below graph minimum of 0
- 632 items above graph maximum of 119
|
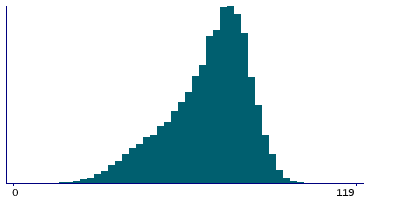
4 Instances
Instance 0 : Initial assessment visit (2006-2010) at which participants were recruited and consent given
170,565 participants, 170,565 items
| Maximum | 1248 |
| Decile 9 | 83 |
| Decile 8 | 79 |
| Decile 7 | 76 |
| Decile 6 | 73 |
| Median | 70 |
| Decile 4 | 66 |
| Decile 3 | 61 |
| Decile 2 | 55 |
| Decile 1 | 46 |
| Minimum | -4813 |
|
|
- There are 507 distinct values.
- Mean = 67.7283
- Std.dev = 32.1766
- 82 items below graph minimum of 0
- 422 items above graph maximum of 120
|
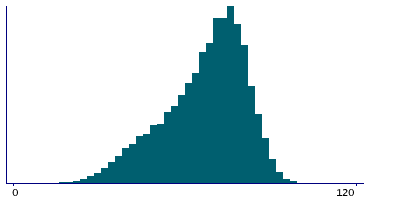
Instance 1 : First repeat assessment visit (2012-13)
20,208 participants, 20,208 items
| Maximum | 1121 |
| Decile 9 | 83 |
| Decile 8 | 80 |
| Decile 7 | 78 |
| Decile 6 | 75 |
| Median | 73 |
| Decile 4 | 70 |
| Decile 3 | 67 |
| Decile 2 | 63 |
| Decile 1 | 55 |
| Minimum | -136 |
|
|
- There are 136 distinct values.
- Mean = 71.8298
- Std.dev = 29.2306
- 3 items below graph minimum of 0
- 43 items above graph maximum of 111
|
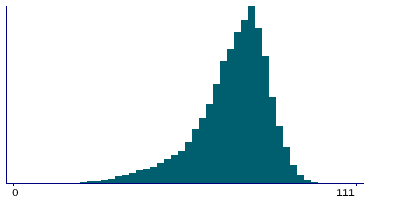
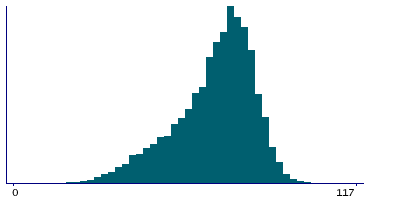
Instance 2 : Imaging visit (2014+)
84,010 participants, 84,010 items
| Maximum | 4952 |
| Decile 9 | 82 |
| Decile 8 | 79 |
| Decile 7 | 76 |
| Decile 6 | 73 |
| Median | 70 |
| Decile 4 | 67 |
| Decile 3 | 62 |
| Decile 2 | 56 |
| Decile 1 | 47 |
| Minimum | -775 |
|
|
- There are 280 distinct values.
- Mean = 68.3605
- Std.dev = 52.409
- 43 items below graph minimum of 0
- 147 items above graph maximum of 117
|
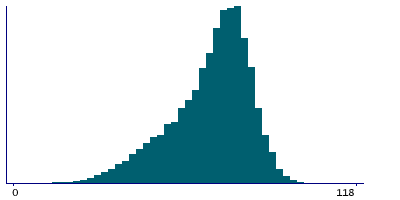
Instance 3 : First repeat imaging visit (2019+)
12,036 participants, 12,036 items
| Maximum | 1237 |
| Decile 9 | 83 |
| Decile 8 | 79 |
| Decile 7 | 77 |
| Decile 6 | 74 |
| Median | 72 |
| Decile 4 | 69 |
| Decile 3 | 65 |
| Decile 2 | 60 |
| Decile 1 | 51 |
| Minimum | -526 |
|
|
- There are 115 distinct values.
- Mean = 69.7321
- Std.dev = 25.964
- 6 items below graph minimum of 0
- 20 items above graph maximum of 115
|
Notes
reflection index is a measure of reflection
A digital volume pulse can be considered to be the summation of a direct and a reflected component. The direct component is due to transmission of a pressure wave from the left ventricle to the finger via the most direct route. The reflected component is formed by pressure transmitted from the heart to the lower body where it is reflected back up the aorta and thence to the finger. if 'b' is the height of direct wave peak and 'a' is the height of reflected wave peak the reflected index = (a/b) * 100%


