Data
72,817 items of data are available, covering 62,902 participants.
Some values have special meanings defined by Data-Coding
100291.
Defined-instances run from 0 to 3, labelled using Instancing
2.
Units of measurement are measures.
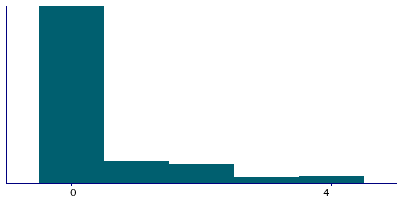
| Maximum | 150 |
| Decile 9 | 2 |
| Decile 8 | 1 |
| Decile 7 | 0 |
| Decile 6 | 0 |
| Median | 0 |
| Decile 4 | 0 |
| Decile 3 | 0 |
| Decile 2 | 0 |
| Decile 1 | 0 |
| Minimum | 0 |
|
|
- There are 29 distinct values.
- Mean = 0.749424
- Std.dev = 2.034
- 2753 items above graph maximum of 4
- 108 items have value -3 (Prefer not to answer)
- 651 items have value -1 (Do not know)
|
4 Instances
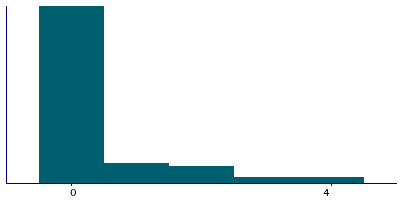
Instance 0 : Initial assessment visit (2006-2010) at which participants were recruited and consent given
40,788 participants, 40,788 items
| Maximum | 150 |
| Decile 9 | 2 |
| Decile 8 | 1 |
| Decile 7 | 0 |
| Decile 6 | 0 |
| Median | 0 |
| Decile 4 | 0 |
| Decile 3 | 0 |
| Decile 2 | 0 |
| Decile 1 | 0 |
| Minimum | 0 |
|
|
- There are 29 distinct values.
- Mean = 0.745186
- Std.dev = 2.23034
- 1646 items above graph maximum of 4
- 92 items have value -3 (Prefer not to answer)
- 498 items have value -1 (Do not know)
|
Instance 1 : First repeat assessment visit (2012-13)
4,453 participants, 4,453 items
| Maximum | 25 |
| Decile 9 | 2 |
| Decile 8 | 1 |
| Decile 7 | 0 |
| Decile 6 | 0 |
| Median | 0 |
| Decile 4 | 0 |
| Decile 3 | 0 |
| Decile 2 | 0 |
| Decile 1 | 0 |
| Minimum | 0 |
|
|
- There are 17 distinct values.
- Mean = 0.603978
- Std.dev = 1.61244
- 110 items above graph maximum of 4
- 1 items have value -3 (Prefer not to answer)
- 28 items have value -1 (Do not know)
|
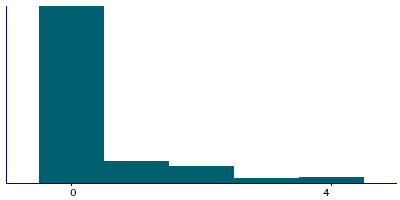
Instance 2 : Imaging visit (2014+)
22,749 participants, 22,749 items
| Maximum | 30 |
| Decile 9 | 2 |
| Decile 8 | 1 |
| Decile 7 | 0 |
| Decile 6 | 0 |
| Median | 0 |
| Decile 4 | 0 |
| Decile 3 | 0 |
| Decile 2 | 0 |
| Decile 1 | 0 |
| Minimum | 0 |
|
|
- There are 19 distinct values.
- Mean = 0.766835
- Std.dev = 1.73532
- 805 items above graph maximum of 4
- 14 items have value -3 (Prefer not to answer)
- 103 items have value -1 (Do not know)
|
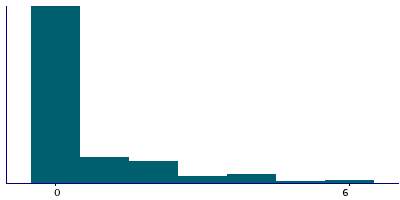
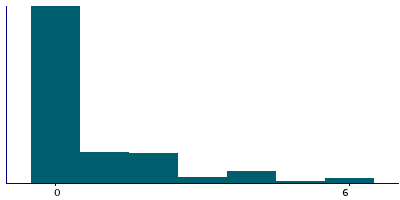
Instance 3 : First repeat imaging visit (2019+)
4,827 participants, 4,827 items
| Maximum | 50 |
| Decile 9 | 3 |
| Decile 8 | 2 |
| Decile 7 | 1 |
| Decile 6 | 0 |
| Median | 0 |
| Decile 4 | 0 |
| Decile 3 | 0 |
| Decile 2 | 0 |
| Decile 1 | 0 |
| Minimum | 0 |
|
|
- There are 17 distinct values.
- Mean = 0.836803
- Std.dev = 1.95506
- 84 items above graph maximum of 6
- 1 items have value -3 (Prefer not to answer)
- 22 items have value -1 (Do not know)
|
Notes
ACE touchscreen question "In an average MONTH, how many measures of spirits or liqueurs would you drink? (there are 25 standard measures in a normal sized bottle; spirits include drinks such as whisky, gin, rum, vodka, brandy)"
The following checks were performed:
- If answer < 0 then rejected
- If answer > 250 then rejected
- If answer > 10 then participant asked to confirm
Field 4440 was collected from participants who indicated they drink alcohol on special occasions or one to three times a month, as defined by their answers to Field 1558
Coding 100291 defines 2 special values:
- -1 represents "Do not know"
- -3 represents "Prefer not to answer"
1 Related Data-Field
| Field ID | Description | Relationship |
|---|
| 1558 | Alcohol intake frequency. | Current Field was collected from participants who indicated they drink alcohol on special occasions or one to three times a month, as defined by their answers to Field 1558 |
1 Application
| Application ID | Title |
|---|
| 31187 | Integrative Prioritization of Loci for Alcohol Use Disorders and Associated Complex Traits |


