Data
640,828 items of data are available, covering 499,832 participants.
Defined-instances run from 0 to 3, labelled using Instancing
2.
Units of measurement are cm.
| Maximum | 195 |
| Decile 9 | 114 |
| Decile 8 | 109 |
| Decile 7 | 106 |
| Decile 6 | 104 |
| Median | 102 |
| Decile 4 | 100 |
| Decile 3 | 98 |
| Decile 2 | 96 |
| Decile 1 | 93 |
| Minimum | 30 |
|
|
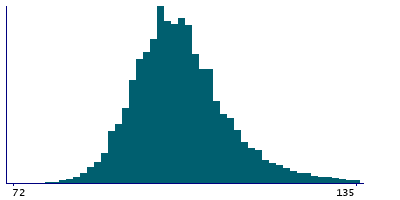
- Mean = 102.887
- Std.dev = 9.28429
- 46 items below graph minimum of 72
- 4506 items above graph maximum of 135
|
4 Instances
Instance 0 : Initial assessment visit (2006-2010) at which participants were recruited and consent given
499,718 participants, 499,718 items
| Maximum | 195 |
| Decile 9 | 115 |
| Decile 8 | 110 |
| Decile 7 | 107 |
| Decile 6 | 104 |
| Median | 102 |
| Decile 4 | 100 |
| Decile 3 | 98 |
| Decile 2 | 96 |
| Decile 1 | 93 |
| Minimum | 30 |
|
|
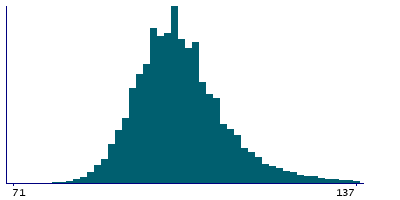
- Mean = 103.402
- Std.dev = 9.2494
- 19 items below graph minimum of 71
- 3028 items above graph maximum of 137
|
Instance 1 : First repeat assessment visit (2012-13)
20,295 participants, 20,295 items
| Maximum | 163 |
| Decile 9 | 114 |
| Decile 8 | 109 |
| Decile 7 | 106 |
| Decile 6 | 104 |
| Median | 102 |
| Decile 4 | 100 |
| Decile 3 | 98 |
| Decile 2 | 96 |
| Decile 1 | 93 |
| Minimum | 41 |
|
|
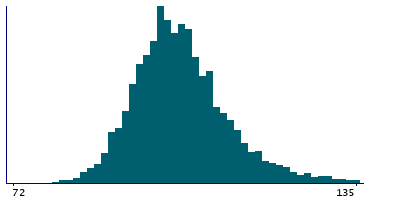
- Mean = 103.015
- Std.dev = 9.23281
- 1 item below graph minimum of 72
- 141 items above graph maximum of 135
|
Instance 2 : Imaging visit (2014+)
99,992 participants, 99,992 items
| Maximum | 182 |
| Decile 9 | 112 |
| Decile 8 | 107 |
| Decile 7 | 104 |
| Decile 6 | 102 |
| Median | 100 |
| Decile 4 | 98 |
| Decile 3 | 96 |
| Decile 2 | 94 |
| Decile 1 | 91 |
| Minimum | 38 |
|
|
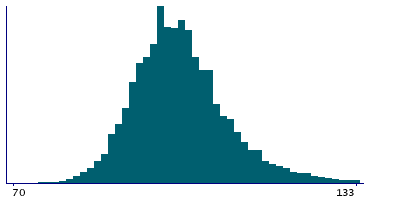
- Mean = 100.797
- Std.dev = 9.1865
- 13 items below graph minimum of 70
- 603 items above graph maximum of 133
|
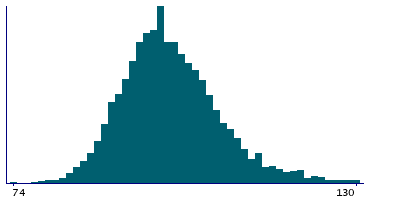
Instance 3 : First repeat imaging visit (2019+)
20,823 participants, 20,823 items
| Maximum | 164 |
| Decile 9 | 111 |
| Decile 8 | 107 |
| Decile 7 | 104 |
| Decile 6 | 101 |
| Median | 99 |
| Decile 4 | 97 |
| Decile 3 | 96 |
| Decile 2 | 93 |
| Decile 1 | 90 |
| Minimum | 74 |
|
|
- Mean = 100.42
- Std.dev = 8.82437
- 125 items above graph maximum of 132
|

