Data
276,453 items of data are available, covering 217,282 participants.
Some values have special meanings defined by Data-Coding
100291.
Defined-instances run from 0 to 3, labelled using Instancing
2.
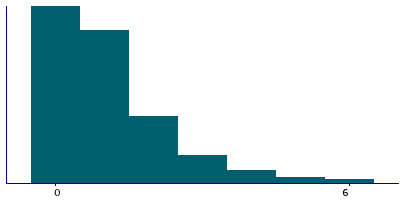
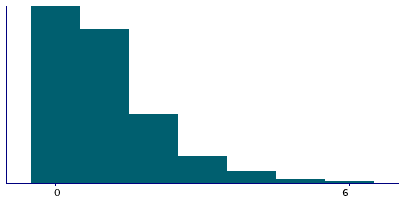
| Maximum | 22 |
| Decile 9 | 3 |
| Decile 8 | 2 |
| Decile 7 | 1 |
| Decile 6 | 1 |
| Median | 1 |
| Decile 4 | 1 |
| Decile 3 | 0 |
| Decile 2 | 0 |
| Decile 1 | 0 |
| Minimum | 0 |
|
|
- There are 21 distinct values.
- Mean = 1.12313
- Std.dev = 1.39109
- 2470 items above graph maximum of 6
- 169 items have value -3 (Prefer not to answer)
- 332 items have value -1 (Do not know)
|
4 Instances
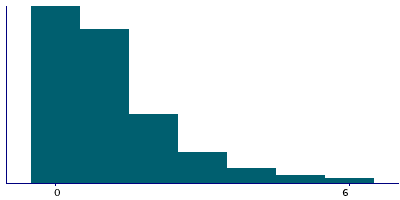
Instance 0 : Initial assessment visit (2006-2010) at which participants were recruited and consent given
150,893 participants, 150,893 items
| Maximum | 22 |
| Decile 9 | 3 |
| Decile 8 | 2 |
| Decile 7 | 1 |
| Decile 6 | 1 |
| Median | 1 |
| Decile 4 | 1 |
| Decile 3 | 0 |
| Decile 2 | 0 |
| Decile 1 | 0 |
| Minimum | 0 |
|
|
- There are 21 distinct values.
- Mean = 1.20095
- Std.dev = 1.49194
- 1812 items above graph maximum of 6
- 143 items have value -3 (Prefer not to answer)
- 237 items have value -1 (Do not know)
|
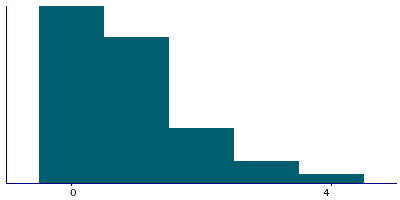
Instance 1 : First repeat assessment visit (2012-13)
17,418 participants, 17,418 items
| Maximum | 14 |
| Decile 9 | 2 |
| Decile 8 | 2 |
| Decile 7 | 1 |
| Decile 6 | 1 |
| Median | 1 |
| Decile 4 | 0 |
| Decile 3 | 0 |
| Decile 2 | 0 |
| Decile 1 | 0 |
| Minimum | 0 |
|
|
- There are 13 distinct values.
- Mean = 0.976951
- Std.dev = 1.22832
- 338 items above graph maximum of 4
- 2 items have value -3 (Prefer not to answer)
- 18 items have value -1 (Do not know)
|
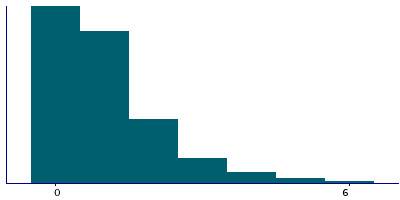
Instance 2 : Imaging visit (2014+)
89,457 participants, 89,457 items
| Maximum | 19 |
| Decile 9 | 3 |
| Decile 8 | 2 |
| Decile 7 | 1 |
| Decile 6 | 1 |
| Median | 1 |
| Decile 4 | 0 |
| Decile 3 | 0 |
| Decile 2 | 0 |
| Decile 1 | 0 |
| Minimum | 0 |
|
|
- There are 17 distinct values.
- Mean = 1.03637
- Std.dev = 1.2562
- 463 items above graph maximum of 6
- 21 items have value -3 (Prefer not to answer)
- 67 items have value -1 (Do not know)
|
Instance 3 : First repeat imaging visit (2019+)
18,685 participants, 18,685 items
| Maximum | 13 |
| Decile 9 | 3 |
| Decile 8 | 2 |
| Decile 7 | 1 |
| Decile 6 | 1 |
| Median | 1 |
| Decile 4 | 0 |
| Decile 3 | 0 |
| Decile 2 | 0 |
| Decile 1 | 0 |
| Minimum | 0 |
|
|
- There are 14 distinct values.
- Mean = 1.04724
- Std.dev = 1.2598
- 101 items above graph maximum of 6
- 3 items have value -3 (Prefer not to answer)
- 10 items have value -1 (Do not know)
|
Notes
This question was introduced part way through fieldwork in April 2009.
ACE touchscreen question "How many OLDER brothers/sisters do you have? (Please include those who have died, and twins. Do not include half-, step- or adopted brothers and sisters)"
The following checks were performed:
- If answer < 0 then rejected
- If answer > 25 then rejected
- If answer > 10 then participant asked to confirm
Field 5057 was collected from participants except those who indicated they were adopted as a child, as defined by their answers to Field 1767
Coding 100291 defines 2 special values:
- -1 represents "Do not know"
- -3 represents "Prefer not to answer"
1 Related Data-Field
| Field ID | Description | Relationship |
|---|
| 1767 | Adopted as a child | Current Field was collected from participants except those who indicated they were adopted as a child, as defined by their answers to Field 1767 |


