Data
102,126 items of data are available, covering 88,066 participants.
Some values have special meanings defined by Data-Coding
100291.
Defined-instances run from 0 to 3, labelled using Instancing
2.
Units of measurement are periods.
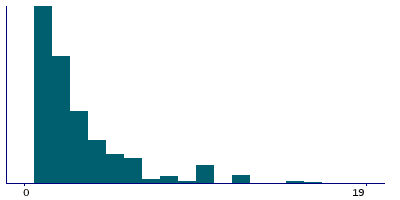
| Maximum | 999 |
| Decile 9 | 10 |
| Decile 8 | 5 |
| Decile 7 | 4 |
| Decile 6 | 3 |
| Median | 2 |
| Decile 4 | 2 |
| Decile 3 | 1 |
| Decile 2 | 1 |
| Decile 1 | 1 |
| Minimum | 1 |
|
|
- There are 137 distinct values.
- Mean = 6.90841
- Std.dev = 31.0831
- 4488 items above graph maximum of 19
- 1605 items have value -3 (Prefer not to answer)
- 27678 items have value -1 (Do not know)
|
4 Instances
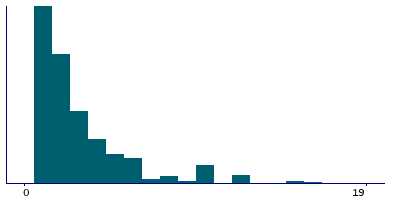
Instance 0 : Initial assessment visit (2006-2010) at which participants were recruited and consent given
60,470 participants, 60,470 items
| Maximum | 999 |
| Decile 9 | 10 |
| Decile 8 | 5 |
| Decile 7 | 4 |
| Decile 6 | 3 |
| Median | 2 |
| Decile 4 | 2 |
| Decile 3 | 1 |
| Decile 2 | 1 |
| Decile 1 | 1 |
| Minimum | 1 |
|
|
- There are 118 distinct values.
- Mean = 7.34983
- Std.dev = 33.6219
- 2717 items above graph maximum of 19
- 1023 items have value -3 (Prefer not to answer)
- 16824 items have value -1 (Do not know)
|
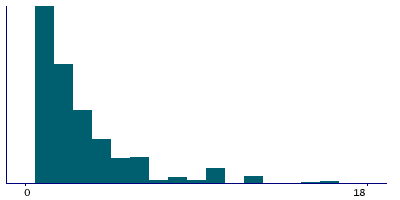
Instance 1 : First repeat assessment visit (2012-13)
6,456 participants, 6,456 items
| Maximum | 936 |
| Decile 9 | 10 |
| Decile 8 | 5 |
| Decile 7 | 4 |
| Decile 6 | 3 |
| Median | 2 |
| Decile 4 | 2 |
| Decile 3 | 1 |
| Decile 2 | 1 |
| Decile 1 | 1 |
| Minimum | 1 |
|
|
- There are 51 distinct values.
- Mean = 6.28535
- Std.dev = 27.4654
- 272 items above graph maximum of 19
- 71 items have value -3 (Prefer not to answer)
- 1675 items have value -1 (Do not know)
|
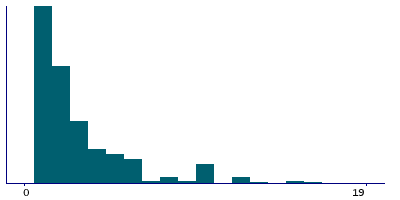
Instance 2 : Imaging visit (2014+)
29,395 participants, 29,395 items
| Maximum | 999 |
| Decile 9 | 10 |
| Decile 8 | 5 |
| Decile 7 | 4 |
| Decile 6 | 3 |
| Median | 2 |
| Decile 4 | 2 |
| Decile 3 | 1 |
| Decile 2 | 1 |
| Decile 1 | 1 |
| Minimum | 1 |
|

|
- There are 85 distinct values.
- Mean = 6.35607
- Std.dev = 26.8295
- 1270 items above graph maximum of 19
- 432 items have value -3 (Prefer not to answer)
- 7664 items have value -1 (Do not know)
|
Instance 3 : First repeat imaging visit (2019+)
5,805 participants, 5,805 items
| Maximum | 999 |
| Decile 9 | 10 |
| Decile 8 | 5 |
| Decile 7 | 4 |
| Decile 6 | 3 |
| Median | 2 |
| Decile 4 | 2 |
| Decile 3 | 1 |
| Decile 2 | 1 |
| Decile 1 | 1 |
| Minimum | 1 |
|
|
- There are 50 distinct values.
- Mean = 5.9309
- Std.dev = 27.9533
- 229 items above graph maximum of 19
- 79 items have value -3 (Prefer not to answer)
- 1515 items have value -1 (Do not know)
|
Notes
ACE touchscreen question "How many periods have you had when you were uninterested in things or unable to enjoy the things you used to for at least a whole week?"
Question was introduced part way through fieldwork in April 2009.
The following checks were performed:
- If answer < 1 then rejected
- If answer > 999 then rejected
Field 5386 was collected from participants who indicated they have been uninterested in things or unable to enjoy things they used to for at least a week, as defined by their answers to Field 4631
Coding 100291 defines 2 special values:
- -1 represents "Do not know"
- -3 represents "Prefer not to answer"
1 Related Data-Field
| Field ID | Description | Relationship |
|---|
| 4631 | Ever unenthusiastic/disinterested fo ... | Current Field was collected from participants who indicated they have been uninterested in things or unable to enjoy things they used to for at least a week, as defined by their answers to Field 4631 |
6 Applications
| Application ID | Title |
|---|
| 1602 | Association between diet and depression |
| 17435 | Exploring the genetics of irritable bowel syndrome: the ?bellygenes? initiative (project approved by bbmri-lpc) |
| 31187 | Integrative Prioritization of Loci for Alcohol Use Disorders and Associated Complex Traits |
| 16577 | Investigations of the genetic overlap between internalising psychiatric disorders and co-morbid physical health disorders. |
| 14801 | Social isolation and health - what are the mechanisms? |
| 41686 | Understanding the biological, lifestyle and environmental risks and outcomes for multimorbidity in psychiatric disorders |


